Lottery Sambad analyzed 1,814 Dear Lottery jackpot records with identifiable sellers from January 2024 to July 2026. Siliguri leads by total number of jackpot tickets sold, smaller locations rise sharply when the data is adjusted for population, and the idea of a consistently “lucky lottery shop” finds little support in the seller-level data.
Key Findings
- 1,814 jackpot records with an identifiable seller were analyzed.
- 20 jackpot tickets were linked to Siliguri — the highest total for any single location in the dataset.
- Siliguri’s 20 jackpot tickets were distributed across 18 different sellers.
- The highest number recorded for any individual seller was just 3 jackpot tickets.
- Many locations near the top of the ranking are in North Bengal, but the available data does not prove that tickets purchased there have better odds of winning.
Where Are Dear Lottery Jackpot Tickets Actually Sold?
Is it possible to identify places where Dear Lottery jackpot tickets appear more often?
To investigate that question, Lottery Sambad analyzed its structured database of published Dear Lottery results covering the period from January 1, 2024, through July 19, 2026.[1][2]
The analysis includes 1,814 jackpot records for which seller information could be identified.
The data reveals two very different patterns.
In absolute numbers, larger and more active lottery markets appear prominently, with Siliguri ranking first. But when jackpot counts are compared with local population, a number of much smaller towns move sharply up the ranking.
At the individual seller level, however, the pattern largely disappears. Even in cities with multiple jackpots, winning tickets were usually distributed among many different sellers rather than repeatedly coming from one shop.
Important: this analysis shows where winning tickets were sold or which seller was associated with them. It does not show where jackpot winners live, and it does not prove that a ticket purchased in one city has better odds of winning than a ticket purchased elsewhere.
To calculate the actual probability of winning by location, sales data would also be required — specifically, the number of lottery tickets sold in each city or through each seller.
Siliguri Leads the Ranking by Total Number of Jackpots
Among all locations in the dataset, Siliguri recorded the highest number of jackpot-winning ticket sales: 20.
Bolpur and Matigara follow with 10 each, while Nabadwip and Raghunathpur recorded nine each. Mathabhanga and Pandua recorded eight.
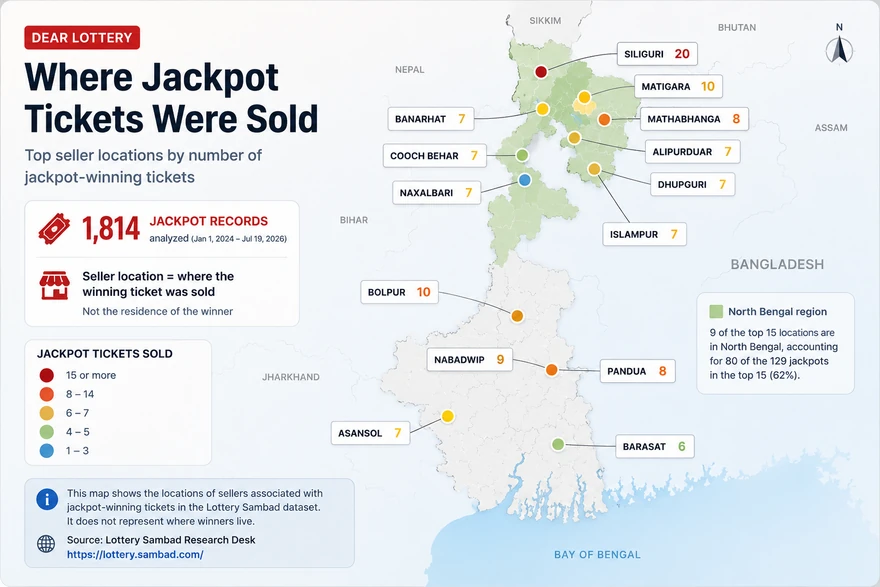
Top 15 Locations by Number of Jackpot Tickets
| # | City / Location | Jackpots |
|---|---|---|
| 1 | SILIGURI | 20 |
| 2 | BOLPUR | 10 |
| 3 | MATIGARA* | 10 |
| 4 | NABADWIP | 9 |
| 5 | RAGHUNATHPUR** | 9 |
| 6 | MATHABHANGA | 8 |
| 7 | PANDUA** | 8 |
| 8 | ALIPURDUAR | 7 |
| 9 | ASANSOL | 7 |
| 10 | BANARHAT | 7 |
| 11 | COOCHBEHAR | 7 |
| 12 | DHUPGURI | 7 |
| 13 | ISLAMPUR** | 7 |
| 14 | NAXALBARI*** | 7 |
| 15 | BARASAT | 6 |
The upper part of the ranking shows a notable concentration of locations associated with North Bengal.
Nine of the 15 leading geographic entries — Siliguri, Matigara, Mathabhanga, Alipurduar, Banarhat, Cooch Behar, Dhupguri, Islampur and Naxalbari — are associated with North Bengal.
Together, those nine locations account for 80 of the 129 jackpots represented in the top 15, or approximately 62%.
That does not mean that 62% of all Dear Lottery jackpots were sold in North Bengal.
The top 15 locations together account for only 129 of the 1,814 jackpot records analyzed — about 7.1% of the full dataset. The overall geography of winning-ticket sales is therefore much more widely distributed.
Even Siliguri, the clear leader in absolute numbers, represents only about 1.1% of the 1,814 jackpot records in the study.
What Happens When Population Is Taken Into Account?
Total jackpot count is only one way to view the data.
Siliguri is a major regional city. Its population was approximately 513,000 in the 2011 Census.[5]Bolpur, by comparison, had roughly 80,000 residents,[6]while Nabadwip had approximately 125,000.[7]
To provide another perspective, we calculated an illustrative ratio: the number of recorded jackpots per 100,000 residents.
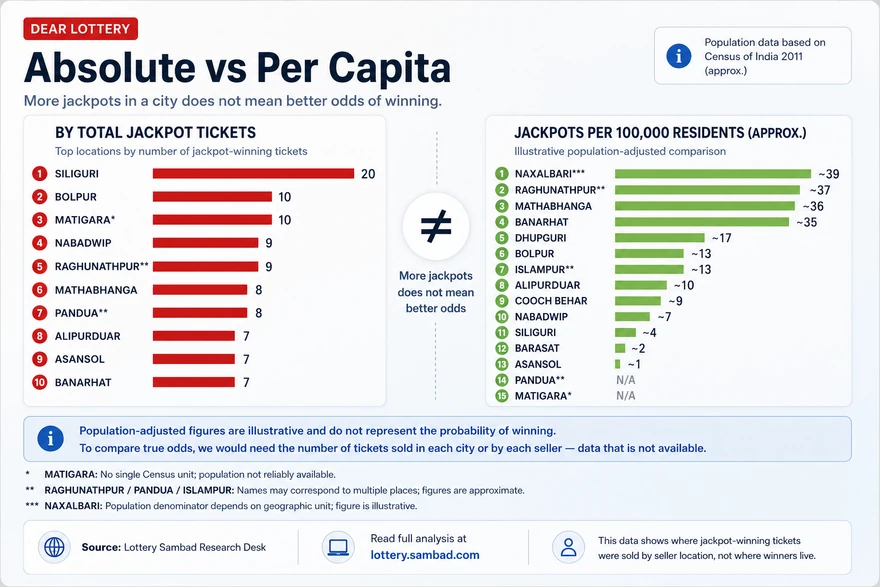
Jackpots per 100,000 Residents
| City / Location | Jackpots | Population ≈ 2011 | Jackpots per 100k |
|---|---|---|---|
| NAXALBARI*** | 7 | ~18,000 | ~39 |
| RAGHUNATHPUR** | 9 | ~24,000 | ~37 |
| MATHABHANGA | 8 | ~22,000 | ~36 |
| BANARHAT | 7 | ~20,000 | ~35 |
| DHUPGURI | 7 | ~40,000 | ~17 |
| BOLPUR | 10 | ~80,000 | ~13 |
| ISLAMPUR** | 7 | ~55,000 | ~13 |
| ALIPURDUAR | 7 | ~70,000 | ~10 |
| COOCHBEHAR | 7 | ~77,000 | ~9 |
| NABADWIP | 9 | ~125,000 | ~7 |
| SILIGURI | 20 | ~513,000 | ~4 |
| BARASAT | 6 | ~278,000 | ~2 |
| ASANSOL | 7 | ~564,000 | ~1 |
| PANDUA** | 8 | N/A | — |
| MATIGARA* | 10 | N/A | — |
The ranking changes dramatically.
Siliguri remains the absolute leader with 20 jackpots, but relative to its population that works out to approximately four recorded jackpots per 100,000 residents.
Asansol, one of the largest cities in the table, recorded seven jackpots — roughly one to 1.3 jackpots per 100,000 residents, depending on the population boundary used.
By contrast, several much smaller locations produce far higher per-capita ratios.
“Jackpots per 100,000 People” Does Not Mean “Better Odds of Winning”
This is the most important statistical limitation of the population-adjusted ranking.
The figures should not be interpreted to mean that a person in a small town is more likely to win the lottery than someone in Siliguri or Asansol.
Population is not the correct denominator for calculating lottery odds.
The correct denominator would be the number of tickets sold.
Consider two hypothetical cities:
- City A has 20,000 residents and sells 1 million lottery tickets.
- City B has 500,000 residents and also sells 1 million lottery tickets.
If both cities produce the same number of jackpot tickets, City A would appear dramatically “luckier” on a per-capita basis, even though the probability per ticket could be exactly the same.
Lottery buyers also do not necessarily purchase tickets in the town where they live.
A small town may serve as a commercial center, transport hub or lottery distribution point for a much larger surrounding area. Sellers may therefore serve customers from neighboring villages, towns and districts.
The “jackpots per 100,000 residents” ranking should therefore be treated as a descriptive geographic indicator, not as a measure of a ticket’s probability of winning.
North Bengal Stands Out — But Ticket Sales May Be the Real Explanation
Despite those limitations, one geographic pattern is difficult to miss.
Siliguri and several other North Bengal locations appear repeatedly near the top of the ranking.
This may reflect a particularly active regional market for Dear Lottery tickets.
However, without city-level sales figures, it is impossible to determine precisely what is driving the pattern.
Possible explanations include:
- a higher number of tickets sold;
- a denser network of lottery sellers;
- higher lottery participation per resident;
- customers traveling from nearby areas to purchase tickets;
- the structure of the ticket distribution network;
- or a combination of these factors.
The statistically defensible conclusion is therefore narrower:
North Bengal is strongly represented among the leading locations where jackpot tickets were sold in our dataset, but the available evidence does not show that a ticket bought there has a higher probability of winning.
Do “Lucky Lottery Sellers” Really Exist?
The seller-level data produced one of the most interesting findings in the study.
Although some cities appear repeatedly, individual sellers rarely do.
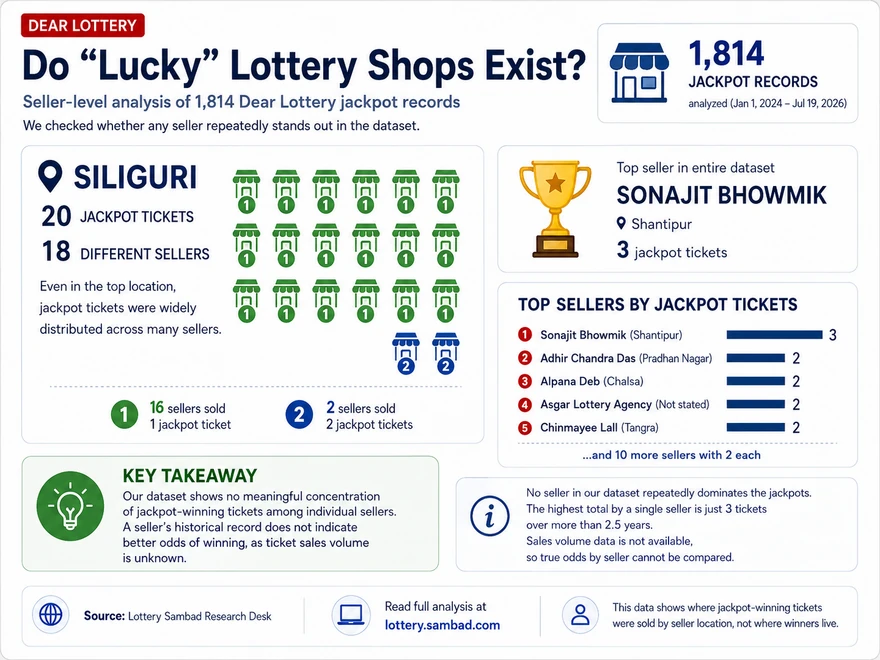
Top Sellers by Number of Jackpot Tickets Sold
| # | Seller | Location | Jackpots |
|---|---|---|---|
| 1 | SONAJIT BHOWMIK | SHANTIPUR | 3 |
| 2 | ADHIR CHANDRA DAS | PRADHAN NAGAR | 2 |
| 3 | ALPANA DEB | CHALSA | 2 |
| 4 | ASGAR LOTTERY AGENCY | Not stated | 2 |
| 5 | CHINMAYEE LALL | TANGRA | 2 |
| 6 | DAWA SHERPA | DARJEELING | 2 |
| 7 | DIPAK KUMAR PAUL | RAGHUNATHPUR | 2 |
| 8 | DIPANKAR BHATTACHARYA | MONDLAI | 2 |
| 9 | GOUTAM DOLUI | BAIDYABATI | 2 |
| 10 | INDRA BANDHOPADHYAY | BELIATORE | 2 |
| 11 | JOY NANDI | BUDGE BUDGE | 2 |
| 12 | MANGAL THOKDAR | SAMSI | 2 |
| 13 | MOUSUMI LOTTERY AGENCY | KALNA | 2 |
| 14 | MRINMOY SAHA | Not stated | 2 |
| 15 | MRITYUNJOY BHATTACHARJEE | BURDWAN | 2 |
Across the entire analyzed period, the highest total recorded for a single seller was only three jackpot tickets.
That record belongs to Sonajit Bhowmik of Shantipur.
Every other seller near the top of the ranking recorded no more than two.
Siliguri Is the Clearest Example
Siliguri ranks first among all locations with 20 jackpot tickets.
Yet those 20 jackpots were distributed among 18 different sellers.
Only two sellers appeared twice. The other 16 appeared once each.
This illustrates an important distinction between geographic concentration at the market level and concentration at the individual seller level.
A city may produce a relatively large number of jackpot tickets without having one dominant “lucky shop.”
Our dataset shows no strong concentration of jackpot-winning tickets among individual sellers. The seller with the highest count appeared only three times across more than two and a half years of records.
That said, the data cannot prove that every seller has performed statistically identically.
To test whether one seller was genuinely outperforming another, we would need to know how many tickets each seller sold.
A seller handling one million tickets naturally has more opportunities to sell a jackpot-winning ticket than a seller handling only ten thousand.
Those sales-volume figures are not available in this dataset.
The correct conclusion is therefore:
The available data does not reveal any meaningful concentration of jackpots among individual sellers and provides no evidence that a particular shop should be considered “lucky” solely because of its historical jackpot record.
The same question can be asked about the winning numbers themselves — and Lottery Sambad tested it on the full verified historical archive in a separate study: Are “Lucky Numbers” Real? We Analyzed 5,497 Dear Lottery Jackpot Results.
What Does “Sold by” Mean in Dear Lottery Results?
The analysis is based on seller information published with certain lottery result records.[1]
A typical entry may look like this:
Sold by: SELLER - ALIAR SK - GORABAZAR & SUB-STOCKIST - BAPI ENTERPRIZE - BERHAMPOREFor this analysis, Lottery Sambad treats the party identified after SELLER as the seller associated with the winning ticket.
The SUB-STOCKIST is a separate participant in the ticket distribution chain and is not counted as a second seller. For official information about the state lottery system, draw results and lottery administration, see Nagaland State Lotteries.[2][3]
This distinction matters because a single “Sold by” line may contain more than one business name and more than one geographic location.
Seller information is also not present in every available result document.
For that reason, the 1,814-record dataset should not be interpreted as every Dear Lottery jackpot drawn during the period.
It represents jackpot records for which seller information was available and could be identified in the underlying data.
The absence of a “Sold by” entry should also not be interpreted as evidence that a jackpot ticket was unsold.
It only means that seller information was not available in the relevant record used for this analysis.
Why Population Data Requires Caution
Population figures used in the comparison are based primarily on the 2011 Census of India.[4]
These figures provide a consistent historical baseline for comparing locations in the dataset, but they should not be treated as current population estimates.
There is another important problem: names appearing in lottery seller records do not always correspond neatly to one Census administrative unit.
Matigara
Matigara is particularly difficult to classify.
The name may refer to a broader administrative area or to a location within the wider Siliguri urban market.
It cannot be reliably matched to one single population figure for the purpose of this analysis.
It is also possible that some records classified as “Matigara” and some classified as “Siliguri” effectively belong to the same broader lottery market.
For this reason, we do not publish a definitive jackpot-per-100,000 figure for Matigara.
Raghunathpur, Pandua and Islampur
Names such as Raghunathpur, Pandua and Islampur can also be geographically ambiguous.
Multiple places may share the same or similar name, while the lottery data does not always provide a district or another unique geographic identifier.
Population-based calculations for these entries should therefore be treated as approximate.
Naxalbari
Naxalbari requires similar caution.
The name can refer to different geographic levels, including a wider administrative area.
The approximately 18,000 population figure used in the illustrative table depends on how the seller location is matched geographically.
As a result, the calculated figure of approximately 39 jackpots per 100,000 residents should be treated as illustrative rather than definitive.
What the 1,814-Jackpot Dataset Actually Tells Us
Several conclusions can be drawn with reasonable confidence from the data.
1. Siliguri Is the Most Frequently Recorded Jackpot Location
Siliguri appears 20 times, more than any other individual geographic entry in the dataset.
2. North Bengal Is Strongly Represented Near the Top
A significant share of the locations at the top of the absolute ranking are in North Bengal.
This suggests a notable concentration of jackpot-ticket sales within those lottery markets, although sales-volume data would be required to explain why.
3. Small Locations Rise Sharply in Population-Adjusted Rankings
When jackpot counts are divided by population, smaller towns naturally move above larger cities.
However, this ratio must not be confused with the probability of winning because ticket-sales volumes are unknown.
4. Individual Sellers Show Very Little Repeat Concentration
The highest seller total in the entire dataset is only three jackpot tickets.
In Siliguri, 20 jackpots were spread across 18 sellers.
5. Jackpot Geography Is Highly Dispersed Overall
Even the highest-ranked city represents only about 1.1% of the analyzed records.
The entire top 15 accounts for only about 7.1% of the 1,814-jackpot dataset.
That indicates that jackpot-winning tickets are geographically distributed across a very large number of locations and sellers.
Conclusion: There Is a Geography of Jackpot Sales — But Not Yet a Geography of “Luck”
Dear Lottery data does reveal geographic patterns.
Some cities and regional markets appear more frequently than others among sellers associated with jackpot-winning tickets.
Siliguri stands out in absolute numbers, while several North Bengal locations are strongly represented near the top of the ranking.
But the data must be interpreted carefully.
We can identify:
where jackpot-winning tickets were more frequently recorded as being sold.
We cannot conclude:
where a lottery ticket has a higher probability of winning.
Answering that second question would require a different dataset — most importantly, the number of tickets sold in each city and by each seller.
How large that unmeasured ticket market may actually be — based on search demand, observed Google traffic and ticket structures — is examined in our separate market-scale study: How Many People Play Dear Lottery? What 56.5M Searches Show.
The same distinction applies to the idea of a “lucky seller.”
No seller in the analyzed data repeatedly dominates the jackpot records. The maximum recorded total is just three jackpot tickets over more than two and a half years.
The most defensible conclusion from the data is therefore:
Dear Lottery jackpot records show a measurable geography of winning-ticket sales, but the available evidence does not establish the existence of inherently “lucky cities” or “lucky sellers.” The observed patterns are more likely to reflect the size and structure of local lottery markets, although that hypothesis can only be properly tested with detailed ticket-sales data.
Methodology
- Data source
- Lottery Sambad database compiled from published Dear Lottery result records.
Dear Lottery is associated with Nagaland State Lotteries.[3]State lotteries in India operate within the central legal framework established by the Lotteries (Regulation) Act, 1998 and the Lotteries (Regulation) Rules, 2010.[8][9]
- Period analyzed
- January 1, 2024 – July 19, 2026.
- Sample size
- 1,814 jackpot records for which a seller could be identified.
- Definition of seller
- The entity identified as “SELLER” in the underlying result information. A “SUB-STOCKIST” is treated as a separate participant in the distribution chain and is not counted as the seller.
- Geographic classification
- Based on the location associated with the seller in the source data. This location should not be interpreted as the residence of the jackpot winner.
- Population data
- Primarily based on Census of India 2011 figures and rounded for comparison.
- Main limitations
- Seller information is not available for every result record; ticket-sales volumes by city and seller are unknown; some geographic names are ambiguous; population figures are historical rather than current; and a seller location does not necessarily represent the buyer’s place of residence.
Sources & References
This study combines original Lottery Sambad data analysis with official state-lottery records, Government of India lottery legislation and Census of India 2011 population data. The jackpot counts, seller rankings, geographic classifications and seller-level concentration statistics are original calculations by the Lottery Sambad Research Desk unless otherwise stated.
- Lottery Sambad Research Desk — Dear Lottery Jackpot Seller Dataset. The primary research dataset used in this study contains 1,814 jackpot records with identifiable seller information covering January 1, 2024 through July 19, 2026. The dataset was compiled from published Dear Lottery result records. Historical Dear Lottery results can also be explored through the Lottery Sambad Results Archive.
- Government of Nagaland, Finance Department — Nagaland State Lotteries Result Gazettes. Official state-lottery result publications used as a primary reference for Dear Lottery draw administration and published draw records. View official Nagaland State Lotteries result gazettes.
- Government of Nagaland, Finance Department — Directorate of Nagaland State Lotteries. Official departmental source describing the Directorate, its role in conducting and monitoring lottery draws, and the use of government-appointed distributors. Visit Nagaland State Lotteries.
- Office of the Registrar General & Census Commissioner, India — Census of India 2011. Primary population source used for the illustrative population-adjusted comparisons in this article. Population figures are historical 2011 Census figures and are not presented as current population estimates. View Census of India 2011 data.
- Census of India 2011 — District Census Handbook, Darjiling, West Bengal. Primary Census reference used for population context involving the Siliguri / Darjiling-area entries and relevant North Bengal locations. View District Census Handbook — Darjiling.
- Census of India 2011 — District Census Handbook, Birbhum, West Bengal. Primary Census reference used for the Bolpur population comparison. View District Census Handbook — Birbhum.
- Census of India 2011 — District Census Handbook, Nadia, West Bengal. Primary Census reference used for the Nabadwip population comparison. View District Census Handbook — Nadia.
- Government of India — The Lotteries (Regulation) Act, 1998. Central legislation governing the organization and regulation of state lotteries in India, including provisions relating to state-organized draws, ticket sales through distributors or selling agents and the conduct of lottery draws. View the Lotteries (Regulation) Act, 1998.
- Government of India, Ministry of Home Affairs — Lotteries (Regulation) Rules, 2010. Central rules supplementing the Lotteries (Regulation) Act and defining terms including “distributor or selling agent” and “draw”. View the Lotteries (Regulation) Rules, 2010.
Source note: The 1,814-record jackpot dataset, city rankings, seller rankings, North Bengal grouping and concentration calculations are original Lottery Sambad Research Desk analysis. Official government and Census sources are used to establish lottery administration, legal context and population denominators. They should not be interpreted as independently verifying Lottery Sambad’s calculated jackpot counts.
Notes on Geographic Data
* MATIGARA: The name cannot be reliably matched to one single Census population unit. It may represent part of the wider Siliguri/Matigara market. No definitive per-capita figure is provided.
** RAGHUNATHPUR / PANDUA / ISLAMPUR: These names may correspond to more than one locality. Where the underlying lottery data does not provide a district or another unique geographic identifier, population comparisons should be treated as approximate.
*** NAXALBARI: The population denominator depends on the geographic unit associated with the seller location. The approximately 39 jackpots-per-100,000 figure is therefore illustrative and should not be interpreted as an official rate or as a measure of lottery odds.
For Journalists, Researchers and Publishers
This analysis is based on original research conducted by Lottery Sambad using a structured dataset of 1,814 Dear Lottery jackpot records with identifiable sellers covering the period from January 1, 2024, to July 19, 2026.
Journalists, researchers, publishers and data analysts may cite the findings, statistics and tables from this study. When referencing the data, please identify Lottery Sambad as the source of the analysis and cite this article as the original research source.
Suggested Citation
“According to a Lottery Sambad analysis of 1,814 Dear Lottery jackpot records with identifiable sellers between January 2024 and July 2026...”
Key Data Available for Citation
- 1,814 jackpot records with identifiable sellers were analyzed between January 1, 2024, and July 19, 2026.
- Siliguri recorded 20 jackpot tickets, the highest total for any single location in the analyzed dataset.
- Siliguri’s 20 jackpot tickets were distributed across 18 different sellers, showing little concentration at the individual seller level.
- The highest number recorded for any single seller was just 3 jackpot tickets during the entire study period.
- The top 15 locations accounted for only approximately 7.1% of all 1,814 analyzed jackpot records, indicating that jackpot-ticket sales were geographically dispersed across a large number of locations.
How to Interpret the Data
The study measures the recorded location of sellers associated with jackpot-winning tickets. It does not identify where winners live and does not measure the probability of winning in a particular city.
Population-adjusted figures are descriptive only. A true comparison of lottery winning rates by location would require ticket-sales volumes for each city or seller, which are not available in the dataset.
Research Methodology
The dataset was compiled by Lottery Sambad from published Dear Lottery result records. Seller-level analysis uses the entity identified as SELLER in the underlying data. SUB-STOCKIST entries are treated separately and are not counted as individual sellers.
Population comparisons are based primarily on Census of India 2011 data. Geographic names that could not be reliably matched to a single administrative population unit are identified in the methodology and excluded from definitive per-capita comparisons where appropriate.
Source: Lottery Sambad original data analysis, January 2024 – July 2026.