Dear Lottery is bought offline, but its results are searched online at an extraordinary scale.
Every month, people in India make tens of millions of Google searches for terms such as lottery sambad, dear lottery, dear lottery result, nagaland state lottery, specific draw times, old results and regional-language versions of the same queries.
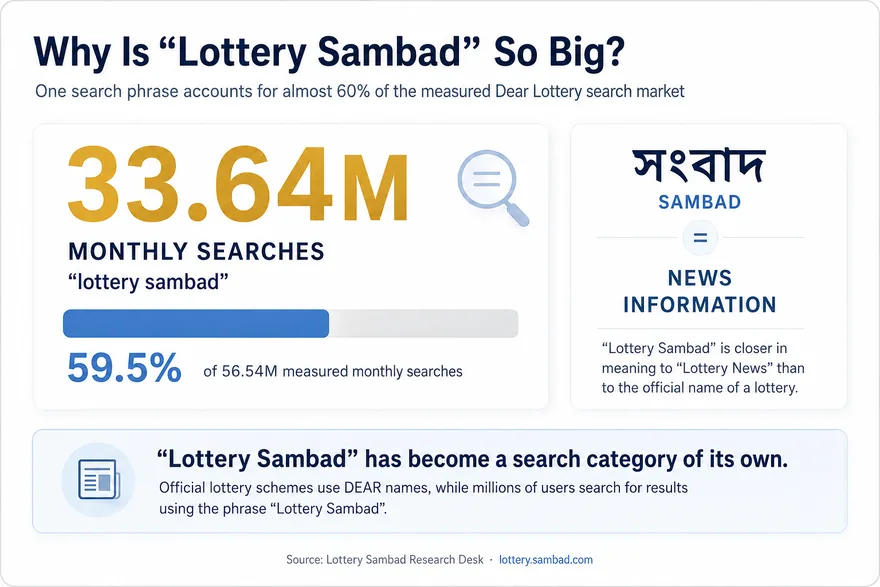
One query alone — “lottery sambad” — is estimated at approximately 33.64 million searches per month.
At the same time, a lottery-results website ranking first for the core query in 2026 generated a run rate of approximately 60.1 million organic Google clicks in 30 days.
Behind that digital demand is a completely different physical system: paper tickets, multiple daily draws, distributors, stockists, sub-stockists, hundreds of series and millions of possible ticket identities.
That creates an obvious question:
How many people actually play Dear Lottery?
There is no reliable public dataset that answers that question directly.
No available source tells us, in one place, how many tickets are printed, how many are distributed, how many remain unsold, how many tickets the average buyer purchases or how many unique people participate each day.
So the Lottery Sambad Research Desk approached the question differently.
We analyzed:
- 6,128 unique search queries connected to the Dear Lottery ecosystem;[1][2]
- historical search-volume trends from 2015 through 2026;
- a 30-day Google Search Console run rate from a results website that ranked first for the core query in 2026;
- official and regulatory documents relating to the physical distribution of lottery tickets;
- the published series structure behind the 1 PM, 6 PM and 8 PM draws;
- and multiple mathematical scenarios for ticket sales and buyer counts.
The purpose of this study is not to manufacture a precise player count from incomplete data.
Instead, it separates what can be measured from what can only be modeled.
Search data shows the scale of information demand. Ticket structures show the scale of possible inventory. Distribution documents show the physical infrastructure behind the market. But without actual ticket-sales data, none of those figures can be converted directly into an exact number of players.
Key Findings
56.5 Million Searches Does Not Mean 56.5 Million People
The first methodological distinction is also the most important:
A search is an event. It is not a person.
The keyword dataset used in this study contains 6,128 unique search queries with a combined estimated monthly search volume in India of:
56,538,260 searches per month.[1][2][3]
The estimates were collected using Ahrefs Keywords Explorer and related keyword data.
That number measures estimated search activity, not unique users.
One person can generate many searches.
For example, someone holding a lottery ticket might:
- check the 1 PM result;
- return for the 6 PM draw;
- search again after 8 PM;
- repeat the same query several times;
- use different spellings of the same term;
- check yesterday's result;
- or open more than one search result.
Another player may never use Google at all.
They may check a ticket with a seller, read a printed result, use an app, watch a live draw, follow a messaging channel or receive the result from someone else.
For that reason, dividing 56.5 million searches by 30 days cannot produce a reliable count of daily players.
What the figure does establish is different:
Dear Lottery-related result checking generates search demand at the scale of tens of millions of monthly search events.
One Search Term Accounts for Almost 60% of the Measured Market
The strongest concentration in the dataset is around one phrase:
lottery sambad — 33.64 million searches per month[1][2]
That represents approximately 59.5% of the combined search volume across all 6,128 analyzed queries.
| Rank | Search Query | Estimated Monthly Searches |
|---|---|---|
| 1 | lottery sambad | 33,640,000 |
| 2 | dear lottery | 3,550,000 |
| 3 | nagaland state lottery | 2,680,000 |
| 4 | dear lottery result | 1,760,000 |
| 5 | lottery sambad today | 893,000 |
| 6 | লটারি সংবাদ | 643,000 |
| 7 | dear lottery sambad | 630,000 |
| 8 | dhankesari | 614,000 |
| 9 | nagaland lottery | 603,000 |
| 10 | nagaland lottery result | 500,000 |
| 11 | today lottery sambad | 436,000 |
| 12 | sambad lottery | 412,000 |
| 13 | nagaland state lottery result | 408,000 |
| 14 | dear lottery result today | 399,000 |
| 15 | lottery sambad lottery sambad | 311,000 |
The first four queries generate approximately 73.6% of all measured search volume.
The first ten account for roughly 80.5%.
A similar pattern appears in the observed search-performance data, where the leading queries account for the overwhelming majority of clicks.
This is a highly concentrated search ecosystem.
Users do not distribute themselves evenly across thousands of different phrases. Instead, a small number of familiar navigational terms dominate.
What Does “Lottery Sambad” Actually Mean?
The dominance of the phrase lottery sambad raises an important linguistic question.
A person unfamiliar with Indian lotteries could reasonably assume that Lottery Sambad is the official name of a lottery.
It is not that simple.
Official lottery materials use DEAR names and individual draw names.[7][8] The official Nagaland State Lotteries and Sikkim State Lotteries publish DEAR draws and weekly schemes under names such as Dear Rise, Dear Shine, Dear Clover, Dear Destiny, Dear Legend and others.
“Lottery Sambad” functions differently.
The word is connected to the Bengali:
সংবাদ
The Bengali word সংবাদ, rendered in Latin script in forms such as sangbad or sambad, means news, information, report or message. A Bengali-English dictionary entry lists the meanings as “information; news; report; message.”[6]
Source: Bengali-English Dictionary — সংবাদ.
In that sense, Lottery Sambad is closer in meaning to:
Lottery News
or:
Lottery Information
rather than the formal name of one specific lottery scheme.
“Lottery Sambad” Has Become a Search Category of Its Own
We cannot establish from the available historical evidence exactly who first popularized the phrase or when it became the dominant search term.
What the search data does show is that the phrase now performs a much broader function.
For millions of searches, lottery sambad effectively means:
“Show me the lottery results.”
The phrase behaves less like the formal name of a single product and more like a navigational label for an entire information category.
That distinction matters.
The official lottery product may be a DEAR draw organized by Nagaland or Sikkim. But the user may still search Google for:
- lottery sambad;
- lottery sambad today;
- লটারি সংবাদ;
- लाटरी संबाद;
- or another variation of the same concept.
The search language and the formal lottery name are therefore not necessarily the same.
Does the Word “Sambad” Tell Us Something About Where the Audience Is?
Potentially — but only if the evidence is interpreted carefully.
We cannot say:
“33.64 million searches for lottery sambad means 33.64 million Bengali speakers.”
That would be incorrect.
The dominant query is written in Latin script, and a phrase can become popular far beyond the language in which it originated.
However, several independent signals point in the same direction.
1. The dominant search expression contains a Bengali-derived information term
The central word sambad is closely associated with the Bengali সংবাদ — news or information.
2. Bengali-script searches have substantial independent demand
The query:
লটারি সংবাদ
was estimated by Ahrefs at approximately 643,000 searches per month.[1][2]
However, observed Google impression data for the same query was substantially higher — approximately 1.6 million normalized monthly impressions in the Search Console comparison.[1][4]
That is roughly 2.5 times the third-party keyword estimate.
This suggests that standard global keyword tools may undercount part of the regional-language search market.
3. Physical distribution documents point directly to West Bengal
Documents reviewed for this research show a formal distribution chain for Dear Lottery tickets marketed in West Bengal through area distributors, stockists and sub-stockists.[10]
4. Earlier jackpot-location research also found a strong North Bengal signal
In a separate original study, Lottery Sambad analyzed 1,814 Dear Lottery jackpot records with identifiable sellers.[14]
That analysis found that North Bengal locations were strongly represented among the leading recorded seller locations.
Importantly, that study also concluded that seller geography cannot be converted into winning odds or player counts without ticket-sales data.
Taken together, these signals support a cautious conclusion:
West Bengal and Bengali-language users appear to represent an important part of the Dear Lottery information market, and the Bengali linguistic context likely played an important role in the rise of the term “Lottery Sambad.”
But the available data cannot tell us what percentage of all players live in West Bengal or what percentage use Bengali as their primary language.
That would require state-level audience and sales data.
Search Demand Grew More Than Tenfold
The long-term search history shows how dramatically digital lottery-result checking expanded over the past decade.
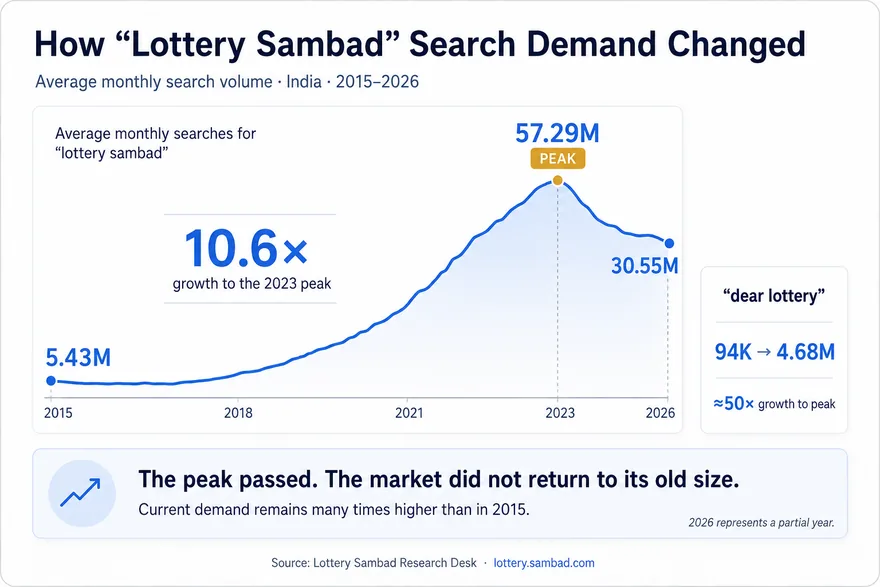
For lottery sambad, the estimated average monthly search volume developed as follows:[1][2][3]
| Year | Average Monthly Searches |
|---|---|
| 2015 | 5.43 million |
| 2016 | 6.35 million |
| 2017 | 8.15 million |
| 2018 | 15.86 million |
| 2019 | 24.53 million |
| 2020 | 27.59 million |
| 2021 | 33.49 million |
| 2022 | 51.14 million |
| 2023 | 57.29 million |
| 2024 | 36.84 million |
| 2025 | 37.27 million |
| 2026 | 30.55 million |
Between 2015 and the 2023 peak, estimated search demand increased by approximately:
10.6×
The query dear lottery grew even faster:
from approximately 94,000 monthly searches in 2015 to approximately 4.68 million at the 2023 peak.
That represents an increase of almost:
50×
Most of the ten largest query families show a broadly similar curve:
- gradual growth through 2017;
- rapid acceleration from 2018 onward;
- another major expansion between 2020 and 2023;
- a peak around 2022–2023;
- then stabilization below the peak but far above pre-2018 levels.
The timing overlaps with the rapid expansion of low-cost mobile internet and smartphone usage in India.
However, the search data alone cannot prove that any single technological or social event caused the growth.
The 2026 figures should also be interpreted as partial-year data rather than a final full-year average.
The Peak Passed — but the Search Market Did Not Disappear
The decline after the exceptional 2022–2023 peak is substantial.
But it should be viewed in historical context.
Even at approximately 30–37 million monthly searches, the lottery sambad query remains many times larger than it was in 2015.
The same is true for dear lottery.
The more defensible description is therefore:
The search market appears to have moved from hypergrowth into a high-volume plateau.
What Are People Actually Searching For?
The wording of the 6,128 queries helps reveal user intent.[1][2]
| Search Segment | Keywords | Estimated Monthly Volume |
|---|---|---|
| Contains “result” | 1,711 | 5.82 million |
| Contains “today” or “aaj” | 1,106 | 3.62 million |
| 1 PM / morning | 328 | 811,050 |
| 8 PM / night | 419 | 857,370 |
| 6 PM / evening | 124 | 100,220 |
| Old / yesterday / archive | 224 | 674,110 |
| Live | 138 | 308,610 |
| Lucky / target / formula / prediction | 48 | 84,080 |
| PDF / download | 24 | 29,350 |
These categories overlap.
A query may contain result, today and 8pm at the same time, so the categories must not be added together as independent shares.
Nevertheless, the behavioral pattern is clear.
Most measurable demand is connected to:
- checking a current result;
- finding today's draw;
- checking a specific time slot;
- retrieving an older result;
- or reaching a result page quickly.
Queries about predictions, formulas, targets and supposedly lucky numbers represent only a small part of the total measured keyword universe.
This does not prove that every searcher bought a ticket.
But it does show that the dominant digital behavior is result checking rather than prediction seeking.
Readers interested in whether historical results themselves reveal genuinely lucky numbers can see our separate analysis: Are “Lucky Numbers” Real? We Analyzed 5,497 Dear Lottery Jackpot Results.
What Does a Number-One Google Position Produce in Practice?
Third-party SEO tools estimate search demand.
To compare those estimates with observed search activity, we analyzed a 30-day run rate from Google Search Console for a lottery-results website that ranked first for the core query in 2026.[1][4][5]
The website is not identified in this study.
Its identity is not necessary for the analysis.
The relevant question is what real search performance looks like when a results resource holds leading positions in a market of this size.
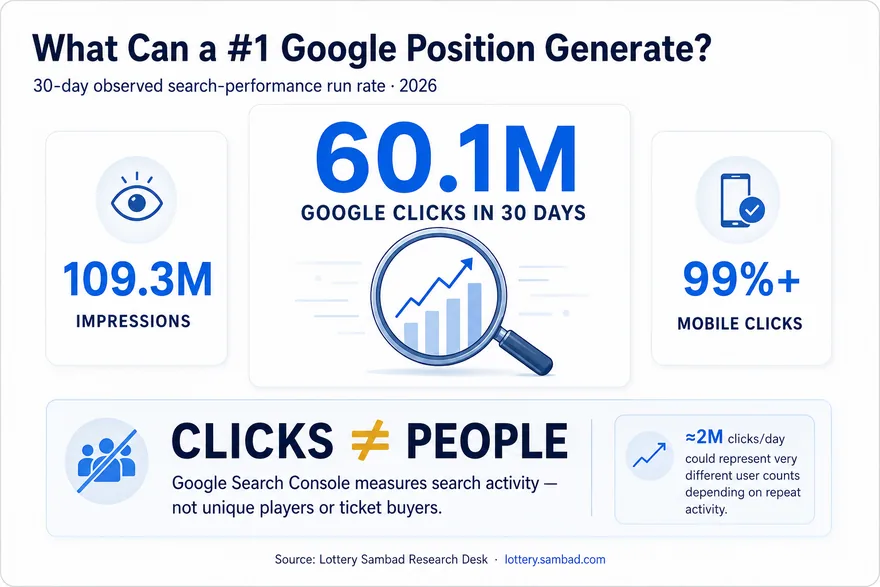
During the latest 30 complete days analyzed, the run rate averaged approximately:
2,003,480 Google clicks per day
and:
3,643,224 Google impressions per day
Equivalent 30-day totals are approximately:
- 60.1 million clicks;
- 109.3 million impressions.[1]
This demonstrates the real traffic potential of top positions in the Dear Lottery results market.
It does not demonstrate that 60.1 million different people visited.
Google Search Console measures clicks, impressions, CTR and position.[4][5] It does not provide a direct census of unique physical users or ticket buyers.
Two Million Clicks per Day Can Represent Very Different Numbers of People
Consider the observed run rate of approximately two million clicks per day.[4][5]
If the average person generated:
| Average Google Clicks per Person per Day | People Corresponding to 2 Million Clicks |
|---|---|
| 1 | ≈2.0 million |
| 1.5 | ≈1.33 million |
| 2 | ≈1.0 million |
| 3 | ≈667,000 |
| 4 | ≈500,000 |
None of those values is presented as the actual user count.
The table demonstrates sensitivity to one unknown variable:
repeat activity per person.
And even after estimating unique searchers, another problem remains:
A search user is not automatically a ticket buyer.
Ahrefs Estimates and Real Google Impressions Tell a Similar — but Not Identical — Story
We compared several major Ahrefs keyword-volume estimates with normalized monthly Google Search Console impressions from the top-ranking results property.[1][2][4][5]
| Query | Ahrefs Monthly Volume | Normalized GSC Impressions / Month | GSC vs. Ahrefs |
|---|---|---|---|
| lottery sambad | 33.64 million | 31.31 million | 93% |
| dear lottery | 3.55 million | 2.67 million | 75% |
| nagaland state lottery | 2.68 million | 2.16 million | 81% |
| dear lottery result | 1.76 million | 1.49 million | 85% |
| lottery sambad today | 893,000 | 1.03 million | 116% |
| লটারি সংবাদ | 643,000 | 1.61 million | 250% |
For several major Latin-script queries, the two sources fall within the same broad order of magnitude.
That provides an independent reason to take the tens-of-millions search scale seriously.
But the comparison also reveals limitations.
For the Bengali query লটারি সংবাদ, measured impressions were roughly 2.5 times the third-party keyword estimate.
This does not mean Google Search Console is a perfect measure of total search volume. Impressions depend on whether and where a particular site appears.
But the comparison suggests that some regional-language demand may be underrepresented in global keyword databases.
For that reason, the 56.5 million figure should be understood as:
a measured baseline for the analyzed keyword universe — not a guaranteed upper limit for every Dear Lottery-related search in India.
The Measured Search Audience Is Overwhelmingly Mobile
In the available Search Console dataset, more than 99% of clicks came from mobile devices.
More than 99% of measured clicks also came from India.[1][4]
Those figures describe the search audience of one leading results property, not every Dear Lottery player.
But they reveal a very strong behavioral pattern.
Dear Lottery result checking is overwhelmingly smartphone-first.
The typical search journey is likely short:
- enter a familiar phrase;
- open a top result;
- check a winning number;
- leave or return after another draw.
That behavior is consistent with the dominance of navigational queries, high click-through rates at the top of the results and repeated searches around draw times.
Google Shows Only One Side of the Market
Everything above describes digital information demand.
But Dear Lottery itself is a paper-ticket product.
Documents reviewed by the Lottery Sambad Research Desk provide a view of the physical and regulatory system behind that digital activity.
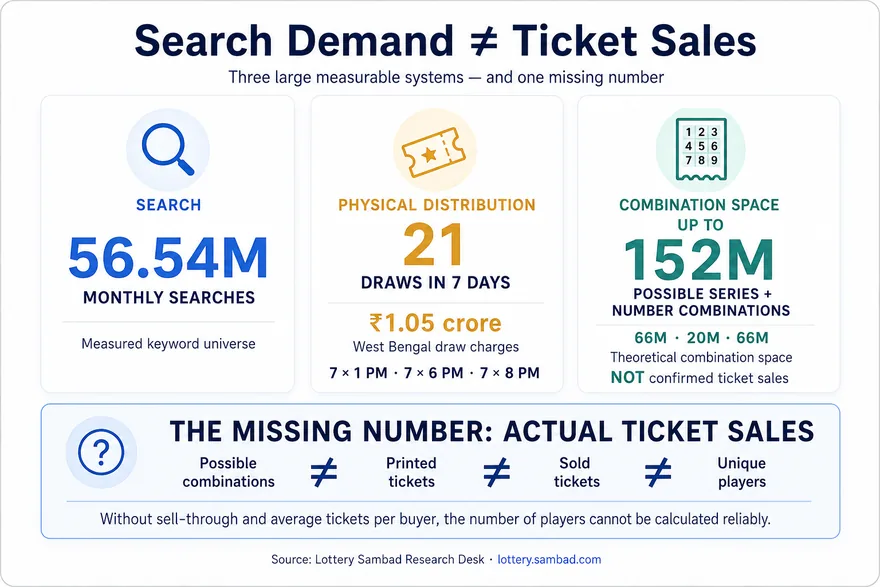
For the week of July 20–26, 2026, the reviewed filing lists 21 Dear Lottery draws:
- 7 Nagaland draws at 1 PM;
- 7 Sikkim draws at 6 PM;
- 7 Nagaland draws at 8 PM.[10]
Each listed weekly ticket had:
The weekly documents therefore independently confirm the three-draw daily structure for the period examined.
Official results and draw information are also published by Nagaland State Lotteries and Sikkim State Lotteries.
₹1.05 Crore in Draw Charges for One Week of 21 Draws
The same weekly filing contains another useful measure of scale.
For the 21 draws listed for July 20–26, the reviewed filing shows:[10]
₹1,05,00,000 in West Bengal Charges for Draw
or:
₹1.05 crore for one week.
The schedule lists ₹5 lakh per draw:
- 14 Nagaland draws: ₹70 lakh;
- 7 Sikkim draws: ₹35 lakh;
- total: ₹1.05 crore.[10]
This figure must not be confused with ticket-sales tax or lottery revenue.
It does not tell us how many tickets were sold.
It shows the scale of the regulatory and distribution infrastructure associated with marketing these draws in West Bengal.
The West Bengal Directorate of State Lotteries operates within a legal framework that includes rules relating to charges for lottery draws.[9]
The Documents Also Reveal a Physical Distribution Chain
The filings reviewed for this research refer to tickets being marketed through:
Area Distributor → Stockists → Sub-stockists[10]
across West Bengal.
This is an important counterweight to the search data.
Google measures the digital act of finding information.
The actual ticket market operates through a separate physical distribution system.
That means even an extremely large Google dataset cannot automatically represent the entire buyer population.
Some players may be highly digital.
Others may purchase and check tickets through entirely offline channels.
A Note on the Status of the West Bengal Documents
The filing materials include a Directorate of State Lotteries “RECEIVED” stamp, but also state:
“CONTENTS NOT VERIFIED.”[10]
For that reason, this article distinguishes between:
- statements made in documents submitted to the Directorate;
- and separate government payment records such as GRIPS/eChallan acknowledgements.
We therefore describe them as documents filed with and received by the relevant West Bengal authorities, rather than claiming that every statement in the covering letters was independently verified by the government.
The Biggest Missing Number Is Still Ticket Sales
Search data tells us how often people look for information.
Distribution documents show that a large physical sales network exists.
But neither tells us:
How many tickets are actually sold?
That distinction becomes especially important when analyzing the lottery's series structure.
152 Million Is a Combination Space — Not a Proven Daily Sales Figure
A complete five-digit lottery number can range from:
00000 to 99999
That creates exactly:
100,000 possible five-digit values.
Our separate analysis of 5,497 verified Dear Lottery jackpot results explains why the five-digit number must be distinguished from the full ticket identity, which also includes series information.
Using the series structure analyzed for the daily draws:
Multiplying each series by 100,000 possible five-digit values gives a mathematical full-ticket combination space of:[1][7][8]
| Draw | Series | Possible Five-Digit Values per Series | Possible Full Series + Number Combinations |
|---|---|---|---|
| 1 PM | 660 | 100,000 | 66 million |
| 6 PM | 200 | 100,000 | 20 million |
| 8 PM | 660 | 100,000 | 66 million |
| Total | 1,520 | — | 152 million |
The correct description of this figure is:
up to 152 million mathematically possible full series-and-number combinations under the analyzed structure.
It should not automatically be described as:
152 million tickets printed or sold every day.
Those are different claims.
Possible Combinations, Printed Tickets and Sold Tickets Are Different Numbers
A complete market analysis must distinguish several stages.
1. Possible combination space
How many unique series-and-number identities can mathematically exist under the scheme.
2. Tickets in the official issue or print run
How many physical tickets are actually produced or formally included in the issue.
3. Tickets distributed
How many tickets enter the wholesale and retail distribution network.
4. Tickets sold
How many tickets are actually purchased by customers.
5. Unique buyers
How many different people purchased those tickets.
None of these five quantities is automatically equal to another.
Other Lottery Scheme Documents Show Why “Sold Tickets” Matters
Two separate Punjab lottery scheme documents reviewed as part of this research provide a useful comparison.
They are not used to estimate sales for the daily Nagaland or Sikkim ₹7 Dear draws.
Their value is methodological: they show how official paper-lottery schemes distinguish between total ticket inventory and tickets actually sold.
Punjab State Dear Rakhi Bumper 2026
The scheme document states that it contains:
14 lakh lottery tickets — 1.4 million tickets
in two series.
It separately states that the first prize is drawn from sold tickets only.[11]
Punjab State Dear 200 Monthly Lottery
A second document specifies:
6 lakh lottery tickets — 600,000 tickets
and again distinguishes the first-prize draw as being conducted from sold tickets.[12]
These documents demonstrate an important operational principle:
The number of tickets in a scheme and the number of tickets actually sold are not necessarily the same thing.
Official Lottery Rules Also Recognize Unsold Tickets
The distinction is not merely theoretical.
Official Sikkim State Lottery rules explicitly contain concepts relating to unsold or scrap lottery tickets.[13]
The existence of a valid ticket number or possible combination therefore does not, by itself, establish that the ticket reached a final buyer.
₹106.4 Crore Is a Theoretical Face-Value Scenario — Not Proven Revenue
If every one of the 152 million possible full combinations corresponded to a physical ₹7 ticket, the arithmetic would be:
152 million × ₹7 = ₹106.4 crore
The arithmetic is correct.
The interpretation requires caution.
The available evidence does not establish that all 152 million possible combinations are physically printed, distributed and sold every day.
Therefore:
₹106.4 crore should be treated as a theoretical full-capacity face-value scenario, not as documented daily Dear Lottery revenue.
What Would Different Sales Levels Look Like?
Because actual sell-through is unknown, the most honest way to examine possible market size is through scenarios.
The following table does not estimate actual sales.
It simply asks what different utilization levels of the 152-million theoretical combination space would imply.
| Hypothetical Share of Combination Space Sold | Tickets Sold | Face Value at ₹7 |
|---|---|---|
| 5% | 7.6 million | ₹5.32 crore |
| 10% | 15.2 million | ₹10.64 crore |
| 25% | 38 million | ₹26.6 crore |
| 50% | 76 million | ₹53.2 crore |
| 75% | 114 million | ₹79.8 crore |
| 100% | 152 million | ₹106.4 crore |
No row in this table is presented as the observed market.
They are sensitivity scenarios.
Even Ticket Sales Would Still Not Tell Us How Many People Play
Suppose actual ticket sales were known.
We would still need one more critical number:
How many tickets does the average buyer purchase?
The same ticket volume can correspond to radically different player counts.
| Hypothetical Sales Level | Tickets Sold | 1 Ticket per Buyer | 2 Tickets | 5 Tickets | 10 Tickets | 20 Tickets |
|---|---|---|---|---|---|---|
| 5% | 7.6m | 7.6m | 3.8m | 1.52m | 760k | 380k |
| 10% | 15.2m | 15.2m | 7.6m | 3.04m | 1.52m | 760k |
| 25% | 38m | 38m | 19m | 7.6m | 3.8m | 1.9m |
| 50% | 76m | 76m | 38m | 15.2m | 7.6m | 3.8m |
| 75% | 114m | 114m | 57m | 22.8m | 11.4m | 5.7m |
| 100% | 152m | 152m | 76m | 30.4m | 15.2m | 7.6m |
This table explains why a single player estimate cannot be derived responsibly from ticket capacity alone.
For example, 7.6 million buyers can appear under several completely different assumptions:
- 25% of the theoretical space sold, with 5 tickets per buyer;
- 50% sold, with 10 tickets per buyer;
- 100% sold, with 20 tickets per buyer.
The same apparent player count can therefore emerge from very different market structures.
What Would a Five-Million-Ticket Day Mean?
Another useful way to see the problem is to start with an arbitrary round number:
5 million tickets sold in one day.
At ₹7 per ticket, that would represent:
₹3.5 crore in ticket sales.
Relative to the 152-million theoretical combination space, five million tickets would equal:
3.29%
If the same sell-through percentage were applied proportionally to the three draw structures, the purely mathematical allocation would be approximately:
- 1 PM: 2.17 million tickets;
- 6 PM: 658,000 tickets;
- 8 PM: 2.17 million tickets.
But there is no evidence that real sales are distributed proportionally in this way. Different time slots may have different demand, distribution, geography and return rates.
More importantly, five million tickets would still not tell us the number of players.
| Average Tickets per Buyer | Buyers Corresponding to 5 Million Tickets |
|---|---|
| 1 | 5 million |
| 2 | 2.5 million |
| 5 | 1 million |
| 10 | 500,000 |
| 20 | 250,000 |
This is why statements such as:
“Five million tickets means five million players”
are only valid if we also assume that every buyer purchases exactly one ticket.
How Large Could the Google Audience Be Relative to the Player Base?
The top-ranking results website generated approximately two million Google clicks per day.
Because clicks are not unique people, consider an illustrative range in which one person generates between one and two search clicks per day.
That would correspond to approximately:
1–2 million daily Google users
for that site.
Again, this is an illustrative conversion, not an observed unique-user count.
We can compare it with several hypothetical ticket-market scenarios:
| Hypothetical Sales Level | Average Tickets per Buyer | Implied Buyers | 1–2m Google Users as Share of Buyers |
|---|---|---|---|
| 10% | 5 | 3.04 million | ≈33–66% |
| 25% | 5 | 7.6 million | ≈13–26% |
| 25% | 10 | 3.8 million | ≈26–53% |
| 50% | 5 | 15.2 million | ≈7–13% |
| 50% | 10 | 7.6 million | ≈13–26% |
| 100% | 20 | 7.6 million | ≈13–26% |
These percentages must not be interpreted as measured online-market shares.
Several unknowns remain:
- not every Google visitor is necessarily a player;
- one person may generate more than two clicks;
- a player may use several websites;
- some users visit directly rather than through search;
- some use apps, YouTube or messaging channels;
- some buyers may remain entirely offline.
The table is useful only as a scenario framework.
Why Some Assumptions Cannot All Be True at the Same Time
Scenario analysis also helps identify combinations that become difficult to reconcile.
For example, suppose only 10% of the theoretical combination space were sold:
15.2 million tickets.
If the average buyer purchased 20 tickets, that would imply:
760,000 buyers.
But if a single leading website were simultaneously receiving 1–2 million unique Google users per day and most of those users were actual players, the assumptions would not fit together comfortably.
That does not prove which assumption is wrong.
It demonstrates why unknown variables cannot simply be assigned arbitrary values and then presented as a factual market estimate.
What Data Would Actually Be Needed to Count Players?
A defensible player estimate would require at least five additional variables.
1. Actual print run
How many physical tickets are produced for each draw.
2. Distribution volume
How many tickets enter the wholesale and retail network.
3. Unsold returns
How many distributed tickets remain unsold.
4. Average tickets per buyer
How many tickets a typical purchaser buys in one day or transaction.
5. Purchase frequency
How often the same buyer participates: daily, several times per week, weekly or occasionally.
With reliable sales data, daily buyers could be approximated as:
Sold tickets per day ÷ average tickets per buyer = estimated daily buyers
Monthly unique players would still require an additional adjustment for repeat participation across different days.
What We Can State with Confidence
1. Dear Lottery-related search demand operates at a tens-of-millions scale
The analyzed keyword universe contains an estimated 56.5 million monthly searches in India.[1][2]
2. “Lottery Sambad” dominates that search market
The phrase alone accounts for approximately 33.64 million monthly searches, or nearly 60% of measured demand.[1][2]
3. “Lottery Sambad” is not the formal name of one specific state lottery scheme
Official lottery materials use DEAR draw names, while sambad is associated with the Bengali word for news, information, report or message.[6]
4. Bengali and West Bengal signals are significant
Bengali-script searches are substantial, the dominant term has a Bengali linguistic context, physical distribution documents point directly to West Bengal, and our earlier seller-location research also found a strong North Bengal presence among leading recorded jackpot-sale locations.[10][14]
These signals support West Bengal as a major market, but they do not quantify its share of all players.
5. A top-ranking website can generate around two million Google clicks per day
This is observed traffic behavior, not a count of unique players.[1][4]
6. The physical lottery has a large formal distribution infrastructure
The reviewed one-week filing covers 21 draws, ₹1.05 crore in draw charges and distribution through area distributors, stockists and sub-stockists.[10][9]
7. The analyzed series structure creates a very large theoretical combination space
Up to 152 million full series-and-number combinations can be derived mathematically from the analyzed 1 PM, 6 PM and 8 PM series structure.[7][8]
8. Combination space is not the same as sales
Possible combinations, printed tickets, distributed tickets, sold tickets and unique buyers are separate quantities.
9. The exact number of daily players remains unknown
No defensible single player figure can be produced without actual sales and purchasing data.
What the Evidence Does Not Support
The available data does not justify statements such as:
- “56.5 million searches means 56.5 million players.”
- “Two million daily clicks means two million daily players.”
- “152 million possible combinations means 152 million tickets are printed.”
- “All printed tickets are sold.”
- “Every buyer purchases one ticket.”
- “Google users represent the entire lottery market.”
- “A specific percentage of Dear Lottery players live in West Bengal.”
Each statement would require data that is not currently available.
The Missing Number Is Actual Sales
This investigation began with a simple question:
How many people play Dear Lottery?
The data leads to a more useful answer.
We can observe three enormous measurable systems.
Search demand
≈56.5 million monthly searches
Observed digital traffic
≈60.1 million Google clicks in a 30-day run rate for one leading results website
Theoretical lottery combination space
up to 152 million full series-and-number identities per day under the analyzed structure
But these numbers describe different things.
Searches ≠ people.
Clicks ≠ players.
Possible combinations ≠ printed tickets.
Printed tickets ≠ sold tickets.
Sold tickets ≠ unique buyers.
The missing bridge between the digital market and the physical market is:
actual ticket sales.
Until reliable print-run, distribution, unsold-return and purchase-size data become available, any single estimate of daily Dear Lottery players depends heavily on assumptions.
The strongest conclusion supported by the evidence is therefore:
Dear Lottery operates at a very large scale both digitally and physically. The analyzed search universe generates tens of millions of monthly searches, a leading results website can receive around two million Google clicks per day, and the lottery operates through a large multi-level physical distribution system with a substantial theoretical ticket combination space. These facts demonstrate scale, but they do not provide a reliable count of unique players without actual ticket-sales data.
Methodology
Search-Demand Dataset
The research analyzed 6,128 unique search queries associated with:
- Lottery Sambad;
- Dear Lottery;
- Nagaland Lottery;
- Dhankesari;
- Bengali-language lottery queries;
- and related search variations.
The combined estimated search volume was:
56,538,260 searches per month in India.[1][2][3]
Keyword data was collected in July 2026 using Ahrefs Keywords Explorer and associated research data.
Historical Search Analysis
Monthly search histories for ten leading queries were aggregated into annual average monthly volumes covering 2015–2026.
The 2026 figures represent an incomplete calendar year.
Google Search Performance
The study analyzed a run rate based on the latest 30 complete days of Google Search Console data from a lottery-results website that ranked first for the core search query in 2026.[4][5]
The website is not identified because this study examines market behavior rather than the traffic performance of a specific publisher.
The observed run rate was approximately:
- 2.0 million clicks per day;
- 3.64 million impressions per day;
- 60.1 million clicks per 30 days;
- 109.3 million impressions per 30 days.[1]
Search Console clicks and impressions are not interpreted as unique-user counts.
Linguistic Analysis
The meaning of Bengali সংবাদ was checked against a Bengali-English dictionary, which gives meanings including information, news, report and message.[6]
The linguistic origin is used as contextual evidence only.
It is not used to infer a user's state, ethnicity or primary language from a search query.
Distribution Documents
The research reviewed documents relating to the marketing of Dear Lottery tickets in West Bengal for the period July 20–26, 2026.[10]
The reviewed material lists 21 draws across the 1 PM, 6 PM and 8 PM schedules, along with draw charges, ticket price, first-prize amount and distribution information.
Government payment acknowledgements were distinguished from statements made in covering letters submitted by distributors.[10]
Ticket Combination Analysis
The 152-million figure is a mathematical calculation based on the analyzed series structure:
- 660 series × 100,000 five-digit values for 1 PM;
- 200 series × 100,000 for 6 PM;
- 660 series × 100,000 for 8 PM.[7][8]
It is described as a theoretical full series-and-number combination space.
It is not treated as evidence that 152 million physical tickets are printed or sold daily.
Comparative Lottery Scheme Documents
Punjab State Dear Rakhi Bumper and Punjab State Dear 200 Monthly documents were examined only to illustrate the operational distinction between total scheme tickets and sold tickets.[11][12]
They are not used to estimate the sales volume of daily Nagaland or Sikkim Dear draws.
Internal Lottery Sambad Research
This study should also be read alongside two earlier original investigations:
- Where Are Dear Lottery Jackpot Tickets Sold? Lottery Sambad Analyzes 1,814 Jackpot Records
- Are “Lucky Numbers” Real? We Analyzed 5,497 Dear Lottery Jackpot Results
Historical result records can also be explored through the Old Lottery Sambad results archive.
Sources & References
This study combines original Lottery Sambad search-market analysis, an anonymized first-party Google Search Console dataset, third-party keyword-volume estimates, official state-lottery sources, regulatory documents and reviewed paper-lottery distribution filings. Unless otherwise stated, all combined keyword totals, normalized 30-day run rates, cross-source comparisons, theoretical ticket-space calculations and market-size scenarios are original calculations by the Lottery Sambad Research Desk.
- Lottery Sambad Research Desk — Dear Lottery Search-Demand and Search-Performance Dataset. The primary analytical dataset for this study contains 6,128 deduplicated Dear Lottery-related search queries for India, historical search-volume series covering 2015–2026, and an anonymized first-party Google Search Console dataset used to calculate the 30-day search-performance run rate. The figures specific to this study — including 56.54 million combined monthly searches, the top-query rankings, 60.1 million normalized 30-day clicks, 109.3 million normalized impressions and all scenario tables — were calculated by the Lottery Sambad Research Desk.
- Ahrefs — Keywords Explorer. Third-party keyword-research source used to obtain search-volume, keyword-family and historical search-demand estimates for India. Ahrefs Keywords Explorer.
- Ahrefs — Keyword and Search Traffic Metrics. Methodological reference explaining Ahrefs search-volume metrics. Ahrefs defines search volume as the estimated average number of monthly searches for a query in a target country and currently calculates the metric using a 12-month average. Ahrefs — Keyword and Search Traffic Metrics.
- Google Search Console — Performance Report. Official Google documentation defining Search Console performance metrics including clicks, impressions, CTR, position, queries, countries and device categories. Google Search Console — Performance Report.
- Google Search Console — Performance Report Data and Aggregation. Official Google documentation used when interpreting property-level click and impression totals and explaining why Search Console data must not be treated as a direct count of unique people. Google Search Console — About Performance Report Data.
- Accessible Dictionary — Bengali-English entry for সংবাদ. Linguistic source used for the Bengali word সংবাদ, which includes the English meanings “information,” “news,” “report” and “message.” Bengali-English Dictionary — সংবাদ.
- Government of Nagaland, Finance Department — Nagaland State Lotteries. Official government source for Nagaland Dear Lottery administration, result gazettes and draw structure. Official result gazettes identify the Nagaland numbering / series framework and distinguish the first-prize full series-and-number combination from the five-digit number component. Nagaland State Lotteries — Result Gazettes.
- Government of Sikkim, Directorate of Sikkim State Lotteries — Dear 6 PM Weekly Lottery Scheme. Official 2026 Sikkim scheme source used for the Dear 6 PM draw, MRP, state-lottery administration and the official 6 PM scheme structure. View the official Dear 6 PM Weekly Lottery Scheme.
- Government of West Bengal, Finance Department — Directorate of State Lotteries. Official West Bengal source describing the Directorate of State Lotteries, the legal framework governing lottery draws in the state and the West Bengal Lotteries (Regulation on Payment of Charges for Draw) Rules, 2011. West Bengal Directorate of State Lotteries.
- Lottery Sambad Research Archive — Dear Lottery Distribution Filing, July 20–26, 2026. Reviewed filing covering 21 Dear Lottery draws marketed in West Bengal during July 20–26, 2026. The document lists seven 1 PM Nagaland draws, seven 6 PM Sikkim draws and seven 8 PM Nagaland draws, ticket MRP, first-prize amount and West Bengal Charges for Draw. The filing also describes distribution through an Area Distributor, Stockists and Sub-stockists. Attached GRIPS/eChallan pages document the corresponding government payments. View the reviewed weekly distribution filing.
- Punjab State Dear Rakhi Bumper 2026 — Reviewed Official Scheme Document. Comparative paper-lottery scheme reviewed by the Lottery Sambad Research Desk. The document specifies 14 lakh tickets in the scheme and separately states that the first prize is drawn from sold tickets only. This document is used only to illustrate the distinction between scheme inventory and tickets actually sold. It is not used to estimate sales of the daily ₹7 Nagaland or Sikkim Dear draws. View the reviewed Punjab Dear Rakhi Bumper scheme.
- Punjab State Dear 200 Monthly Lottery — Reviewed Official Scheme Document. Comparative scheme document specifying 6 lakh tickets and separately distinguishing tickets in the scheme from tickets sold. It is used methodologically and is not used to estimate Dear 1 PM, 6 PM or 8 PM ticket sales. View the reviewed Punjab Dear 200 Monthly scheme.
- Government of Sikkim — Sikkim State Lottery (Regulation) Rules, 2023. Official regulatory source used for the distinction between valid lottery ticket structures, sold / unsold tickets, draw procedures and state-lottery administration. Sikkim State Lottery (Regulation) Rules, 2023.
- Lottery Sambad Research Desk — Dear Lottery Jackpot Seller & Location Analysis. Earlier original Lottery Sambad study of 1,814 jackpot records with identifiable sellers. It is referenced in this article only as an independent internal research signal concerning the geographic importance of West Bengal and North Bengal. Where Are Dear Lottery Jackpot Tickets Sold?.
Source note: Ahrefs provides third-party keyword estimates; Google Search Console provides observed search-performance metrics for the anonymized first-party property; official Nagaland, Sikkim and West Bengal sources establish lottery administration, draw schemes and regulatory context. The combined 6,128-keyword dataset, 56.54-million search total, 30-day traffic normalization, Ahrefs-versus-GSC comparison, 152-million theoretical combination-space calculation and all buyer / sell-through scenarios are original Lottery Sambad Research Desk calculations unless otherwise stated.
Notes on Interpretation
- Search volume is an estimate, not a census of people.
- A Google search is not the same thing as a ticket purchase.
- Google Search Console clicks are not unique users.
- A user checking results is not necessarily a lottery player.
- The term “Lottery Sambad” is not used as proof of a user's location or primary language.
- The Bengali linguistic origin of “Sambad” is treated as a market signal, not a demographic measurement.
- Possible series-and-number combinations are not the same as physical printed tickets.
- Printed tickets are not necessarily distributed tickets.
- Distributed tickets are not necessarily sold tickets.
- Sold tickets are not the same as unique buyers.
- All player-count tables in this article are scenario calculations, not estimates of observed actual player counts.
- Actual market sizing requires print-run, sales, unsold-return and average-purchase data.
For Journalists, Researchers and Publishers
This study is based on original analysis conducted by the Lottery Sambad Research Desk using search-demand data, historical keyword trends, observed Google search-performance data, lottery distribution documents and structured lottery-series information.
Journalists, researchers, publishers and data analysts may cite the findings and tables from this article with attribution to Lottery Sambad Research Desk.
Suggested Citation
“According to a Lottery Sambad Research Desk analysis of 6,128 Dear Lottery-related search queries, the measured keyword universe represents approximately 56.5 million monthly searches in India. A 30-day search-performance dataset from a website ranking first for the core query showed a run rate of approximately 60.1 million Google clicks. The study found that these figures demonstrate the scale of Dear Lottery information demand but cannot be converted into an exact number of players without actual ticket-sales and purchase-size data.”
Key Data Available for Citation
- 6,128 unique search queries analyzed.
- 56.54 million estimated monthly searches in India.
- 33.64 million monthly searches for “lottery sambad.”
- “Lottery sambad” represents approximately 59.5% of the analyzed search volume.
- The search volume for “lottery sambad” increased approximately 10.6× between 2015 and its 2023 peak.
- “Dear lottery” grew by approximately 50× between 2015 and its 2023 peak.
- A top-ranking results website generated a run rate of approximately 60.1 million Google clicks and 109.3 million impressions over 30 days.
- More than 99% of measured clicks were mobile.
- 21 Dear draws were documented in one seven-day period: seven each at 1 PM, 6 PM and 8 PM.
- The reviewed weekly documents show ₹1.05 crore in West Bengal Charges for Draw for those 21 draws.
- The analyzed series structure creates a mathematical space of up to 152 million full series-and-number combinations per day.
- 152 million is not presented as the number of tickets printed or sold.
- The actual number of Dear Lottery players remains unknown without sales and purchase-frequency data.
About This Research
This original analysis was prepared by the Lottery Sambad Research Desk.
Lottery Sambad publishes structured Dear Lottery results, historical archives and original data-driven research on lottery results, jackpot patterns, seller geography, search behavior, prize structures and historical draw records.
The purpose of this research is to separate directly observed evidence from inference.
Where a dataset supports a factual conclusion, the finding is reported as a fact.
Where an answer depends on unknown variables, the article uses scenario analysis rather than presenting a single speculative number as an observed result.