What happens when more than 55,000 Dear Lottery second-prize numbers are analyzed digit by digit?
Lottery Sambad Research Desk examined 55,320 five-digit second-prize results published across 5,532 Dear Lottery draws from April 1, 2021 through August 1, 2026.
The dataset covers all three daily draw times: 1 PM, 6 PM and 8 PM, with ten five-digit second-prize numbers included for every analyzed draw.
That produces:
- 55,320 complete five-digit results;
- 276,600 individual digits;
- more than five years of observations;
- and enough data to test not only repeated numbers, but each digit position separately.
The main finding is unusual.
All five digit positions show statistically significant departures from a perfectly uniform 0–9 distribution.
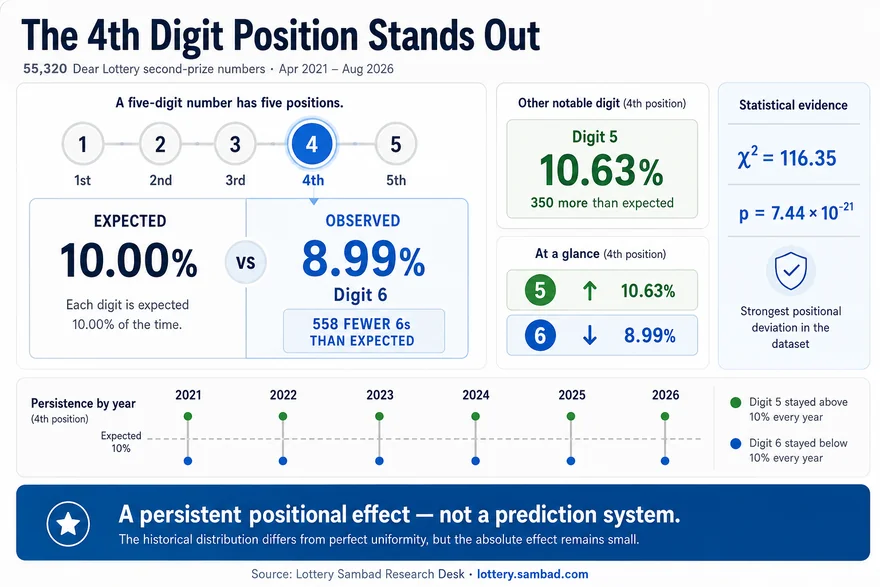
The strongest effect appears in the fourth position — the tens digit. The digit 6 appeared there only 8.99% of the time, while the digit 5 appeared 10.63% of the time.
The direction of that effect remained visible in every calendar year from 2021 through 2026.
There is another important layer to the data.
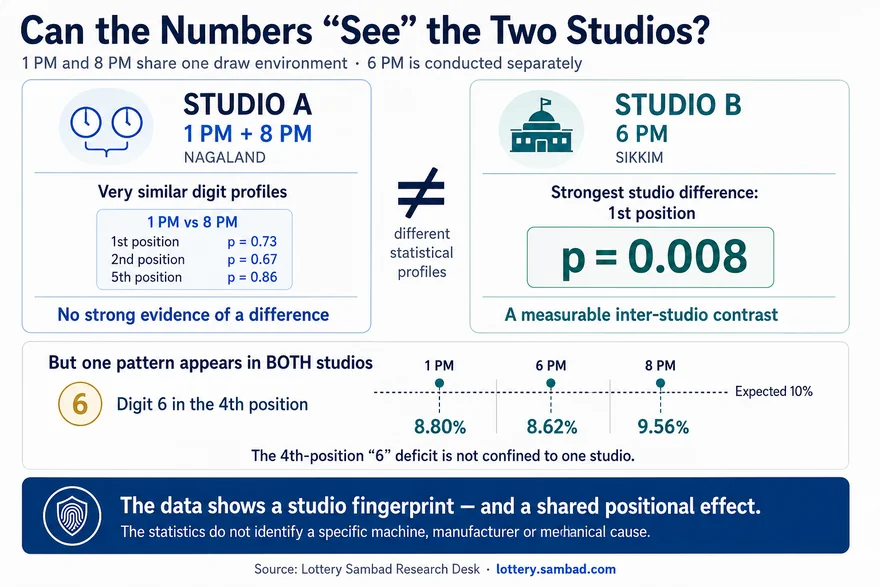
The 1 PM and 8 PM draws are produced from the same Nagaland studio environment, while the 6 PM draw is conducted separately by Sikkim State Lotteries. The statistical profiles partly reflect that physical separation: 1 PM and 8 PM are extremely similar to each other, while 6 PM shows measurable differences in some digit positions.
Yet when we stop looking at individual positions and instead analyze complete five-digit values, their repeat frequency looks remarkably ordinary.
Small positional biases are visible in the digits, while the overall pattern of complete-number repeats remains very close to what a large random process would predict.
Key Findings
55,320second-prize five-digit numbers analyzed
5,532complete draws
276,600individual digits analyzed
42,561unique five-digit values
57,439values out of 100,000 never appeared
3 numbersappeared six times — the historical maximum
497 daysmedian gap between repeat appearances
4 casesof the same number appearing in two different draw slots on the same day
541palindrome appearances versus about 553 expected
44444appeared twice
00000 and 99999both appeared once
0 caseswhere a published second-prize number matched the jackpot number in the same draw
43%of unique jackpot five-digit values later or earlier appeared in the second prize on other dates
8.99%strongest positional effect: digit 6 in the fourth position instead of 10%
What Exactly Is the Dear Lottery Second Prize?
The Dear Lottery second prize is structurally different from the jackpot.
The first prize is based on a full series-and-number combination. The same five-digit jackpot number across the remaining eligible series is associated with the consolation-prize structure.
The second prize, by contrast, consists of ten separately drawn five-digit numbers. Those five-digit results are applied according to the official prize structure.[2][4]
Official draw documents published by Nagaland State Lotteries and Sikkim State Lotteries show this separation between first prize, consolation prize and the ten-number second-prize category.
The monetary value of this prize has not remained identical across every historical scheme. For parts of the analyzed period, official result documents list ₹9,000, while later schemes may list ₹10,000.
For that reason, this research focuses on the stable analytical unit:
the ten five-digit numbers published as the official second-prize results.
Two Studios, Two Physical Draw Environments
The three daily Dear Lottery draw times are part of the same broader results ecosystem, but they are not all produced in the same studio.
1 PM and 8 PM — Nagaland
The 1 PM and 8 PM draws are organized by Nagaland State Lotteries and are conducted within the same Nagaland studio environment.[2][3]
Official Nagaland result publications identify Kohima as the draw location, and the official Nagaland live-draw section groups the Dear 1 PM and Dear 8 PM draws within the same lottery system.
6 PM — Sikkim
The 6 PM draw is conducted separately by Sikkim State Lotteries.[4]
Official Sikkim scheme documents identify the draw location as the Directorate of Sikkim State Lotteries in Deorali, Gangtok.
The Sikkim rules describe a mechanical draw process in which digits are drawn randomly under the supervision of designated officials and judges.[4][5]
This gives us a useful natural comparison:
- Studio A: 1 PM + 8 PM;
- Studio B: 6 PM.
If some statistical features arise from the physical draw environment, the profiles of 1 PM and 8 PM should be more similar to each other than either is to 6 PM.
The data partly supports exactly that pattern.
How a Five-Digit Result Is Structured
Every second-prize result contains five digit positions.
Position: 1 2 3 4 5 Example: 4 8 2 6 1Under a perfectly uniform model, each digit from 0 through 9 would have a probability of approximately:
10%
in every position.
With 55,320 numbers in the dataset, the expected count for each digit in each position is:
5,532 appearances.
Random variation means the observed value will almost never be exactly 5,532. The question is whether the deviations are small enough to remain compatible with a simple uniform model.
All Five Positions Depart from Perfect Uniformity
The full position-by-digit matrix is:
| Position \ Digit | 0 | 1 | 2 | 3 | 4 | 5 | 6 | 7 | 8 | 9 |
|---|---|---|---|---|---|---|---|---|---|---|
| 1st | 5,346 | 5,629 | 5,405 | 5,604 | 5,750 | 5,350 | 5,411 | 5,641 | 5,357 | 5,827 |
| 2nd | 5,372 | 5,589 | 5,855 | 5,404 | 5,286 | 5,833 | 5,549 | 5,556 | 5,602 | 5,274 |
| 3rd | 5,856 | 5,505 | 5,493 | 5,468 | 5,420 | 5,442 | 5,713 | 5,468 | 5,247 | 5,708 |
| 4th | 5,745 | 5,559 | 5,726 | 5,463 | 5,643 | 5,882 | 4,974 | 5,531 | 5,590 | 5,207 |
| 5th | 5,394 | 5,579 | 5,657 | 5,701 | 5,084 | 5,525 | 5,708 | 5,538 | 5,675 | 5,459 |
Each position was tested against a uniform 10% distribution using a chi-square goodness-of-fit test.
| Position | χ² (df=9) | p-value | Most Frequent Digit | Least Frequent Digit |
|---|---|---|---|---|
| 1st | 52.45 | 3.72 × 10⁻⁸ | 9 — 10.53% | 0 — 9.66% |
| 2nd | 67.43 | 4.85 × 10⁻¹¹ | 2 — 10.58% | 9 — 9.53% |
| 3rd | 50.80 | 7.62 × 10⁻⁸ | 0 — 10.59% | 8 — 9.48% |
| 4th | 116.35 | 7.44 × 10⁻²¹ | 5 — 10.63% | 6 — 8.99% |
| 5th | 58.38 | 2.74 × 10⁻⁹ | 6 — 10.32% | 4 — 9.19% |
Even after adjusting for the fact that five positional tests were performed, all five remain statistically significant.
The correct interpretation is:
If every digit truly had exactly a 10% probability in every position, deviations this large or larger would be extremely unlikely to arise from ordinary sampling noise alone.
A p-value does not measure the probability of cheating, machine failure or future recurrence of the same pattern.
Statistically Strong Does Not Mean Practically Large
A dataset containing 276,600 individual digits can detect very small differences.
The largest visible contrast occurs in the fourth position:
- digit 5 — 10.63%;
- digit 6 — 8.99%.
That is a difference of:
1.64 percentage points.
Statistically, this is highly convincing.
Practically, however, both digits still appear frequently.
The effect is therefore important for understanding the draw process, but it does not automatically create a useful prediction strategy.
Statistical significance is not the same as a practical betting advantage.
The Fourth Position Has a Persistent “6” Deficit
The fourth position — the tens digit — produces the strongest deviation in the entire dataset.
Under a uniform model, digit 6 should have appeared approximately:
5,532 times.
It actually appeared:
4,974 times.
That is:
558 fewer appearances than expected, or approximately 10.1% below the expected count.
Digit 5 moved in the opposite direction.
Expected:
5,532
Observed:
5,882
That is 350 appearances above expectation, approximately 6.3%.
The difference between digits 5 and 6 within the same position is:
908 results.
This is the strongest single positional contrast in the study.
The Same Direction Appears Year After Year
A natural question is whether the fourth-position result was created by one unusual year.
The annual breakdown says otherwise.
| Year | Digit 6 in 4th Position | Digit 5 in 4th Position |
|---|---|---|
| 2021 | 8.56% | 10.48% |
| 2022 | 8.99% | 10.75% |
| 2023 | 8.61% | 10.29% |
| 2024 | 9.19% | 10.45% |
| 2025 | 9.36% | 11.01% |
| 2026 | 9.18% | 10.90% |
In every calendar year represented:
- digit 6 remained below 10%;
- digit 5 remained above 10%.
The 2021 and 2026 rows cover partial calendar years within the study window, so they should not be treated as complete annual samples.
The important observation is the persistence of direction:
The overall fourth-position imbalance was not created by one short period or one exceptional year.
The Fourth-Position Effect Appears in Both Studios
If the digit-6 deficit occurred only in one physical draw environment, a local equipment effect would be an obvious hypothesis.
But the same direction appears in all three draw times.
| Draw | Digit 6 in 4th Position | Digit 5 in 4th Position |
|---|---|---|
| 1 PM | 8.80% | 10.55% |
| 6 PM | 8.62% | 10.67% |
| 8 PM | 9.56% | 10.67% |
| Uniform expectation | 10.00% | 10.00% |
This matters because 6 PM is produced in a different studio from 1 PM and 8 PM.
The result therefore argues against a simple explanation involving one isolated machine.
However, the data does not prove that both studios use:
- the same equipment manufacturer;
- identical drum designs;
- identical balls;
- or the same mechanical configuration.
Possible shared explanations could include:
- similar mechanical draw technology;
- similar digit-ball systems;
- shared operational procedures;
- the same logical sequence for constructing five-digit numbers;
- common restrictions on invalid or duplicate prize outcomes;
- or another feature not observable from published results alone.
The safest conclusion is:
The fourth-position effect is visible across both studio environments and therefore cannot be explained simply as an obvious defect of one isolated machine.
Can the Data Detect the Two Studios?
To test whether the physical separation leaves a statistical trace, the digit distributions were compared position by position.
Two comparisons were performed:
- 1 PM versus 8 PM — same studio environment;
- 1 PM + 8 PM versus 6 PM — different studios.
| Position | 1 PM vs 8 PM | Studio A (1 PM + 8 PM) vs 6 PM |
|---|---|---|
| 1st | p=0.73 | p=0.008 |
| 2nd | p=0.67 | p=0.058 |
| 3rd | p=0.045 | p=0.032 |
| 4th | p=0.09 | p=0.51 |
| 5th | p=0.86 | p=0.22 |
1 PM and 8 PM
Four of the five positions show no nominally significant difference at all.
The third position gives p=0.045, but that result does not remain significant after adjusting for the five positional comparisons.
Therefore:
There is no strong evidence that the 1 PM and 8 PM digit profiles differ from each other.
That is consistent with their shared studio environment.
It does not prove that the exact same physical drum or machine was used in every draw.
6 PM versus the Nagaland studio
The clearest studio difference appears in the first position:
p=0.008.
This remains meaningful after a simple correction for five positional comparisons.
The third position gives a weaker nominal difference at p=0.032, and the second position is borderline at p=0.058.
The most defensible conclusion is:
The data contains a clear inter-studio contrast in the first position and weaker evidence of additional differences in the second and third positions.
The Statistical Profiles Also Correlate More Strongly Within the Same Studio
Each draw time can be represented as a 50-cell profile:
5 positions × 10 digits.
The correlation between the 1 PM and 8 PM deviation profiles is approximately:
r = +0.69
Compared with approximately:
r ≈ +0.56
for cross-studio pairs.
The contrast is even stronger in the first two positions, where the within-studio correlations reach approximately:
- +0.79;
- +0.87.
Cross-studio comparisons are lower, roughly in the +0.35 to +0.57 range.
This is consistent with a studio-level statistical fingerprint.
But correlation alone cannot identify:
- a machine model;
- a manufacturer;
- a specific drum;
- or a physical mechanism behind the differences.
The 6 PM Studio Is Closer to Uniformity in Some Positions
The 6 PM distribution is not significantly different from uniform in:
- the second position — p=0.24;
- the fifth position — p=0.41.
Its detectable departures are concentrated in the:
- first;
- third;
- fourth positions.
By comparison, the combined 1 PM + 8 PM studio profile shows significant non-uniformity across all five positions.
It is reasonable to say:
The 6 PM studio profile is closer to perfect uniformity in some digit positions.
It would be incorrect to translate that into:
“6 PM is more honest.”
Statistical uniformity is only one characteristic of a draw process. It is not a complete measure of fairness.
Overall Digit Frequency Is Also Slightly Uneven
Combining all five positions produces:
276,600 individual digits.
Under a perfectly uniform model, each digit would appear:
27,660 times.
| Digit | Observed | Share | Difference from Expected |
|---|---|---|---|
| 0 | 27,713 | 10.02% | +53 |
| 1 | 27,861 | 10.07% | +201 |
| 2 | 28,136 | 10.17% | +476 |
| 3 | 27,640 | 9.99% | −20 |
| 4 | 27,183 | 9.83% | −477 |
| 5 | 28,032 | 10.13% | +372 |
| 6 | 27,355 | 9.89% | −305 |
| 7 | 27,734 | 10.03% | +74 |
| 8 | 27,471 | 9.93% | −189 |
| 9 | 27,475 | 9.93% | −185 |
Overall:
χ² = 29.09, df=9, p≈0.00063.
The historically most frequent digits were:
- 2 — 10.17%;
- 5 — 10.13%;
- 1 — 10.07%.
The least frequent were:
- 4 — 9.83%;
- 6 — 9.89%;
- 8 and 9 — approximately 9.93%.
The difference between the highest and lowest overall digit frequencies is only:
0.34 percentage points.
So terms such as “hot” and “cold” describe the historical dataset, not a demonstrated future advantage.
Complete Numbers Follow the Birthday-Paradox Pattern Remarkably Well
Now consider the complete five-digit values rather than individual digits.
There are exactly:
100,000 possible values from 00000 to 99999.
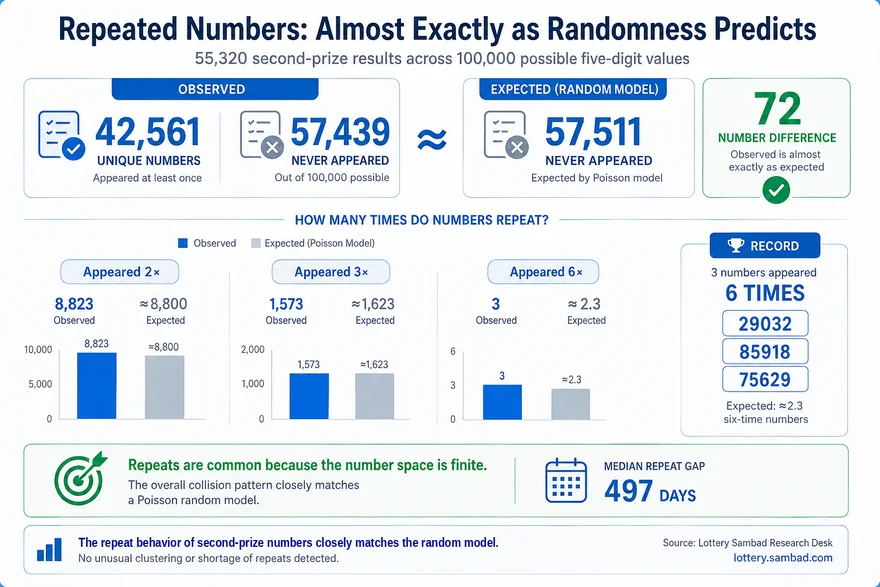
Among 55,320 observed second-prize results:
42,561 were unique.
That means:
57,439 possible numbers never appeared.
Under a simple Poisson approximation:
λ = 55,320 / 100,000 = 0.5532
the expected number of values that never appear is approximately:
57,511.
The difference between observation and model is only 72 numbers.
| Number of Appearances | Observed Values | Poisson Expectation |
|---|---|---|
| 0 | 57,439 | 57,511 |
| 1 | 31,914 | 31,815 |
| 2 | 8,823 | 8,800 |
| 3 | 1,573 | 1,623 |
| 4 | 217 | 224 |
| 5 | 31 | ≈25 |
| 6 | 3 | ≈2.3 |
The agreement is strikingly close.
This does not prove that every aspect of the draw process is perfectly random.
But it does show:
There is no unusual concentration of repeated complete five-digit numbers. Their repeat profile is extremely close to ordinary random-collision expectations.
Three Numbers Appeared Six Times
The historical maximum was six appearances.
29032
First observed: April 7, 2021
Last observed: October 30, 2025
85918
First observed: April 7, 2021
Last observed: March 8, 2026
75629
First observed: August 17, 2022
Last observed: June 28, 2026
The Poisson model predicts approximately 2.3 numbers with six appearances. The observed result was 3 numbers.
That is extremely close to the expected order of magnitude.
Another 31 five-digit values appeared five times, including visually memorable examples such as:
- 11125;
- 11412;
- 77667;
- 03888.
Their appearance patterns may look striking, but the total frequency of repeated numbers remains close to what the mathematical model predicts.
The Same Number Appeared in Two Draws on the Same Day Four Times
Four same-day cross-slot repeats were found:
| Number | Date | Draw Times |
|---|---|---|
| 48978 | March 13, 2023 | 1 PM and 6 PM |
| 93624 | March 3, 2024 | 6 PM and 8 PM |
| 58162 | February 14, 2025 | 1 PM and 8 PM |
| 62262 | April 19, 2026 | 1 PM and 8 PM |
Two of those four occurred between the 1 PM and 8 PM draws produced within the same Nagaland studio environment.
The other two connected different studios.
For three daily draws containing ten unique numbers each, the chance of at least one cross-slot match on a particular day is approximately:
0.30%.
Across approximately 1,844 complete three-slot days, the model predicts around:
5.5 such days.
Observed:
4.
So the same-day repeats are memorable individually but not statistically unusual collectively.
Repeats in Consecutive Draws
When the Nagaland studio sequence is considered as:
1 PM → 8 PM → next 1 PMthe same five-digit value appeared in consecutive studio draws five times during the study period.
There were also:
11 cases where a number returned on the next calendar day.
One example:
13919 appeared on August 21 and August 22, 2025 — both times in the 6 PM draw.
Eight times, a number appeared again in the next draw of the same time slot.
Example:
37578 — May 31, 2024 at 1 PM and June 1, 2024 at 1 PM.
The theoretical expectation for such same-slot next-draw repeats is approximately 5.5.
Eight observed cases remain within an ordinary statistical range.
The median interval between repeat appearances of the same value was:
497 days.
The mean was:
581 days.
The higher mean reflects a long right tail: some values return quickly, while others remain absent for years.
Why the Jackpot Number Cannot Also Be Published as a Second-Prize Number
The Dear Lottery prize structure makes the jackpot five-digit number special within its own draw.
The first prize is awarded to the ticket containing the correct:
- series;
- and five-digit jackpot number.
The same five-digit jackpot number across the other eligible series is already associated with the consolation-prize structure.
This means the entire five-digit jackpot family has already been allocated to the higher prize categories.
Publishing the same five-digit number again as one of the ten independent second-prize numbers would cause the second-prize result to overlap with the already assigned jackpot/consolation number family.
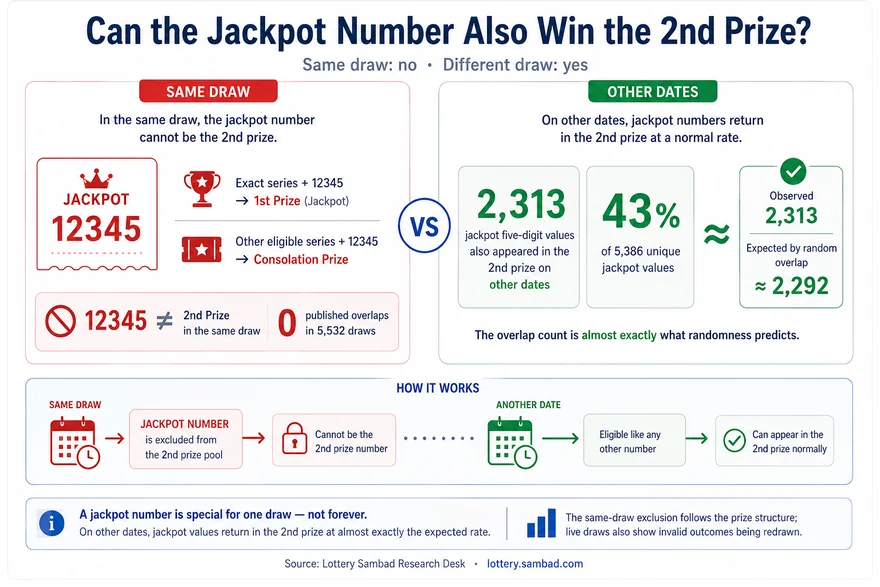
The jackpot five-digit number therefore cannot be accepted as a separate second-prize result in the same draw.
Live draw broadcasts also show the operational handling of invalid duplicate outcomes: when a disallowed result appears during the mechanical process, a staff member intervenes and the relevant drum is run again.
The official prize structures establish the separation of prize categories, while the broadcasts show how invalid overlaps are handled operationally.
5,532 Draws — Zero Published Jackpot/Second-Prize Overlaps
Across the complete study period:
0
published second-prize numbers matched the jackpot five-digit value in the same draw.
This is best interpreted as:
No violation of the prize-category separation was found in 5,532 analyzed draws.
It should not be presented as standalone statistical proof of the rule.
If ten second-prize numbers were hypothetically selected independently and were allowed to match the jackpot, the expected number of matches across 5,532 draws would be only:
about 0.553.
Under that counterfactual random model, seeing zero matches would still have a probability of roughly:
57.5%.
So the dataset alone would not establish the exclusion rule.
The conclusion comes from the combination of:
- the official prize structure;
- the observed redraw procedure in live broadcasts;
- and the complete historical record showing no published overlap.
But Jackpot Numbers Reappear in the Second Prize on Other Dates
The same-draw exclusion does not follow a number forever.
The jackpot dataset contains:
5,386 unique five-digit jackpot values.
Of those:
2,313 — approximately 43%
appeared at least once in the second prize on another date.
For comparison, if 5,386 values were compared with the 42,561 unique second-prize values under a simple random-overlap model, the expected intersection would be approximately:
2,292.
Observed:
2,313.
The difference is very small.
This provides a useful contrast:
A jackpot number is excluded from the second prize within its own draw, but on other dates it reappears at approximately the ordinary rate expected from two large sets of five-digit values.
For more on jackpot-number behavior, see our separate investigation: Are “Lucky Numbers” Real? We Analyzed 5,497 Dear Lottery Jackpot Results.
Digit Sums Form the Expected Bell-Shaped Distribution
The most common digit sum was:
22
with:
3,346 results.
The theoretical center for five independent decimal digits is:
22.5.
The full distribution follows the familiar bell-like shape, rising from very low sums, peaking near the center and falling again toward 45.
Both absolute extremes appeared:
- 00000 — digit sum 0;
- 99999 — digit sum 45.
Each appeared once.
All-Even and All-Odd Numbers Match Theory Almost Perfectly
The probability that all five digits are even is:
(5/10)^5 = 1/32
The same applies to five odd digits.
The theoretical expectation for each category in 55,320 results is:
1,728.75.
Observed:
- all five digits even — 1,727;
- all five digits odd — 1,771.
The result is extremely close to the binomial expectation.
Repdigits: 44444 Appeared Twice
There are ten possible five-digit repdigits:
00000 11111 22222 33333 44444 55555 66666 77777 88888 99999
Seven of them appeared during the study period.
| Number | Appearances |
|---|---|
| 00000 | 1 |
| 11111 | 1 |
| 22222 | 1 |
| 44444 | 2 |
| 55555 | 1 |
| 88888 | 1 |
| 99999 | 1 |
Still absent:
- 33333;
- 66666;
- 77777.
Total repdigit appearances:
8.
Theoretical expectation:
5.53.
Eight looks higher than expected, but the probability of observing eight or more is still roughly 19%.
So:
Repdigits have been slightly fortunate historically, but not unusually so.
Palindromes Land Almost Exactly Where Theory Predicts
Examples of five-digit palindromes include:
12321 45554 00700
There are exactly:
1,000 possible five-digit palindromes.
Expected appearances in 55,320 draws:
553.2.
Observed:
541.
Again, the data sits very close to the random expectation.
Ascending, Descending and Memorable Numbers
Ascending patterns such as:
01234 12345 45678
appeared four times in total.
The famous:
12345
appeared once.
Descending patterns such as:
98765 65432 54321
appeared three times.
The James Bond-style:
00007
also appeared once.
These numbers are memorable to humans, but their appearance does not imply a special underlying probability.
How Often Do Digits Repeat Inside One Number?
All five digits were different in:
30.08%
of results.
The theoretical probability is:
30.24%.
Numbers containing four identical digits appeared:
259 times.
Numbers whose largest repeated-digit group contained three identical digits appeared:
4,529 times.
Round Endings
Numbers ending in:
000
appeared:
47 times
versus approximately 55.3 expected.
Numbers ending in:
00
appeared:
567 times
versus approximately 553.2 expected.
Both results remain close to the simple random model.
The Most Common Two-Digit Endings
Players often pay particular attention to the last two digits of a number.
The historical leaders were:
| Ending | Appearances |
|---|---|
| 52 | 623 |
| 46 | 622 |
| 48 | 622 |
| 55 | 618 |
| 03 | 614 |
The uniform expectation for each two-digit ending is:
553.2 appearances.
The least common were:
| Ending | Appearances |
|---|---|
| 60 | 436 |
| 64 | 454 |
| 69 | 462 |
| 63 | 472 |
| 94 | 479 |
These rankings should not be interpreted independently from the positional effects.
For example:
- the deficit of digit 6 in the fourth position suppresses many endings beginning with 6;
- the deficit of digit 4 in the fifth position suppresses many endings ending in 4.
This means a rare ending such as 64 partly inherits both positional deficits.
The ranking is therefore a historical description, not proof that specific two-digit endings are independently “hot” or “cold.”
The Final Digit
The most frequent fifth-position digits were:
- 6 — 5,708;
- 3 — 5,701.
The least frequent was:
4 — 5,084 appearances.
The Most Common First Two Digits
The leading two-digit prefixes were:
| Prefix | Appearances |
|---|---|
| 45 | 656 |
| 75 | 633 |
| 12 | 620 |
Among the least common were:
- 59 — 472;
- 83 — approximately 492;
- 84 — approximately 492.
As with endings, some of these differences reflect the underlying first- and second-position digit frequencies rather than a separate property of the two-digit prefix itself.
What Happens Inside One Set of Ten Numbers?
Each second-prize draw contains ten five-digit results.
Ten numbers create:
45 unordered pairs.
That allows us to ask how frequently the numbers in one draw cluster unusually close together.
Three Draws Contained Consecutive Numbers
Three times, two consecutive integers appeared in the same second-prize set:
- 73379 + 73380 — November 17, 2021, 6 PM;
- 21554 + 21555 — July 25, 2024, 6 PM;
- 72944 + 72945 — August 19, 2024, 1 PM.
Across 5,532 draws, the uniform model predicts approximately five such neighboring pairs.
Observed:
3.
There is nothing unusual about that result.
Pairs Within Five Numbers of Each Other
Pairs with an absolute difference of five or less appeared:
24 times.
The theoretical expectation:
approximately 24.9.
The median minimum gap between the closest two values in a draw was:
725.
Matching the Last Four Digits
In 24 cases, two numbers in the same draw shared the final four digits but had different first digits.
For example:
12345 92345
With identical full five-digit duplicates excluded, the expected number of such cases is approximately:
22.4.
Observed:
24.
This gives no evidence of a special rule preventing four-digit suffix matches.
Six of Ten Numbers Began With 7
The strongest concentration of one first digit occurred on:
April 29, 2021 — 8 PM.
Six of the ten numbers began with 7:
- 70442;
- 74303;
- 75703;
- 76639;
- 77650;
- 79373.
For a predetermined digit, getting six or more appearances among ten first positions is rare.
But across 5,532 draws, approximately 0.8 such events would be expected for one specified digit.
One observed case therefore does not require an unusual explanation.
Three Draws Used All Ten Possible First Digits
At the opposite extreme, three draws contained all ten first digits from 0 through 9 exactly once.
The theoretical expectation is approximately:
2 draws.
Observed:
3.
The Average Minimum and Maximum Are Almost Exactly Where Theory Predicts
The average smallest value among the ten second-prize numbers was:
09174.
The average largest:
91167.
For ten uniform values between 00000 and 99999, theoretical reference values are roughly:
- minimum — 09090;
- maximum — 90909.
The observed averages are very close.
Does 1 PM, 6 PM or 8 PM Give Players an Advantage?
At the broad level, the three time slots look similar.
The studio-level analysis reveals subtle positional differences, particularly between the Nagaland studio and 6 PM.
But the magnitude is small.
No draw time produces a clear practical advantage for predicting a complete five-digit result.
The meaningful distinction is analytical:
The two studio environments leave slightly different statistical profiles, but those differences are not a demonstrated betting strategy.
Does the Day of the Week Matter?
No statistically convincing day-of-week advantage was identified.
The leading digit frequencies by weekday generally stayed around:
10.1%–10.5%.
There is no stable evidence that:
- Monday is better than Friday;
- weekends behave differently from weekdays;
- or one day produces systematically more useful number patterns.
Is There a Long-Term Drift?
No broad year-by-year drift appears across the overall digit distributions.
The most notable persistent feature is the fourth-position imbalance:
- digit 6 below 10%;
- digit 5 above 10%.
The strength of the effect varies by year, but its direction remains consistent throughout the study period.
Which Numbers Were “Hot” in the Latest 12 Months?
As of August 1, 2026, the following values appeared three times during the preceding 12 months:
- 19437;
- 96950;
- 35437;
- 95221;
- 51881;
- 72850;
- 19619;
- 46743;
- 94300;
- 86366.
This list describes recent history only.
It does not mean these numbers have become more likely to appear again.
The Most Overdue Two-Digit Ending Was Only Missing for 10 Days
At the August 1, 2026 cutoff, ending:
15
had not appeared for ten days.
There are approximately 30 second-prize numbers published per complete three-draw day:
3 draw times × 10 numbers = 30For a specific two-digit ending, the expected number of daily appearances is:
30 × 1% = 0.3.
That corresponds to an average interval of roughly:
3.3 days.
The probability of a predetermined ending being absent for ten days is still around:
4.9%.
A ten-day absence is therefore noticeable, but not extraordinary.
Ending 15 does not become “due” on day eleven.
Repeated Numbers That Have Been Missing for Years
Among values that appeared at least three times historically, some have remained absent for a long period.
Examples include:
- 81040 — last observed May 9, 2021;
- 42551 — July 9, 2021;
- 26098 — September 1, 2021;
- 65463;
- 16174;
- 13033.
These numbers are interesting precisely because they repeated several times and then disappeared.
But a long absence does not increase the probability of an independent future appearance.
How Can Strong Positional Bias and Normal Full-Number Repeats Exist Together?
At first glance, the two major findings may appear contradictory.
At the digit-position level
All five positions differ statistically from an exact 10% distribution.
At the full-number level
The number of unique values and the distribution of repeated values closely follow the Poisson model.
There is no contradiction.
The positional differences are small in absolute terms.
Even the strongest shift moves one digit probability from approximately 10% to 8.99%, while another reaches 10.63%.
When five positions are combined into a space of 100,000 full numbers, the effect on total collision probability is very small.
Using the observed positional frequencies, the probability that two complete numbers match is less than 1% higher than under perfect uniformity.
So the same dataset can legitimately produce:
- extremely small positional p-values;
- and an almost textbook full-number repeat distribution.
Does This Prove a Problem With the Draw Equipment?
No.
The data establishes that the historical results do not perfectly match the simplest model:
every digit has exactly a 10% probability in every position.
It does not establish the physical cause.
Possible explanations could include:
- small characteristics of mechanical drums;
- properties or wear of balls;
- similar equipment designs in two studios;
- loading and cleaning procedures;
- operational rules;
- restrictions on invalid prize results;
- changes in equipment during the study period;
- dependencies between stages of the draw process;
- or unidentified source-data issues.
The fact that the fourth-position digit-6 deficit appears in both Kohima and Gangtok weakens the simplest hypothesis of one defective individual machine.
But the results alone cannot identify a manufacturer, mechanical cause or equipment defect.
Does This Prove the Draws Are Unfair?
No.
A statistically detectable departure from perfect uniformity is not proof of manipulation.
Real physical randomization systems do not necessarily reproduce mathematical perfection at every decimal place over finite samples.
At the same time, many broader tests remain extremely close to theoretical expectation:
- full-number repetition counts;
- palindromes;
- consecutive-number pairs;
- four-digit suffix matches;
- minimum and maximum values;
- same-day repeats;
- all-even and all-odd numbers.
The responsible conclusion is therefore narrower:
The second-prize data contains a small but persistent positional imbalance, while the global behavior of complete five-digit values remains broadly consistent with a large random process.
Can Players Use This as a Prediction System?
The study does not establish a reliable betting system.
Even if digit 6 historically appeared only 8.99% of the time in the fourth position, a player still has to match the remaining four digits.
Other limitations include:
- the data describes the past;
- equipment and procedures may change;
- the physical mechanism behind the effect is unknown;
- the absolute frequency differences are small;
- historical optimization can overfit the dataset;
- no independent future sample has yet demonstrated predictive value.
A specific five-digit number still has a baseline chance of approximately:
1 in 10,000
of appearing among the ten second-prize results in one draw under the simple uniform model.
A real claim of predictive advantage would require a strategy defined in advance and tested on future results that were not used to discover the pattern.
The Main Conclusion
The analysis of 55,320 Dear Lottery second-prize numbers reveals two statistical stories at once.
Story One: the digit positions are not perfectly uniform
All five positions show statistically significant departures from an exact 10% distribution.
The strongest effect occurs in the fourth position:
Digit 6 appeared only 8.99% of the time.
The direction of that effect persisted across every calendar year in the study and appears in both physical studio environments.
The data also contains a measurable distinction between:
- the shared 1 PM / 8 PM Nagaland studio profile;
- and the separate 6 PM Sikkim profile.
Story Two: complete numbers behave surprisingly normally
The number of unseen values, one-time appearances, double repeats, triple repeats and even six-time record holders closely matches the Poisson model.
Palindromes, memorable numbers, nearby pairs and same-day repeats also remain broadly within ordinary probabilistic expectations.
So the evidence does not support either extreme.
It would be wrong to say:
“Every digit is perfectly uniform.”
But it would also be wrong to say:
“We found a reliable way to predict the second prize.”
The most accurate summary is:
Dear Lottery second-prize results show a small, persistent and partly studio-related positional bias. At the same time, the overall behavior of complete five-digit numbers remains remarkably close to what is expected from a large random process.
Methodology
Study Period
April 1, 2021 through August 1, 2026.
Dataset Size
- 5,532 draws;
- 10 second-prize numbers per analyzed draw;
- 55,320 five-digit results;
- 276,600 individual digits.
Every included draw contained the full set of ten second-prize numbers.
Draw Times and Studios
- 1 PM: Nagaland;
- 6 PM: Sikkim;
- 8 PM: Nagaland.
The 1 PM and 8 PM draws were grouped as one Nagaland studio environment. The 6 PM draw was treated separately as the Sikkim studio environment.
Number Normalization
All results were treated as fixed five-character values:
00000–99999
Leading zeros were preserved.
Positional Tests
Each of the five positions was tested separately against:
P(0) = P(1) = ... = P(9) = 10%
Chi-square goodness-of-fit tests with nine degrees of freedom were used.[7]
Exact chi-square survival probabilities are reported in this article.
Studio Comparisons
Digit distributions were compared between:
- 1 PM and 8 PM;
- combined 1 PM + 8 PM and 6 PM.
Multiple positional comparisons were considered when interpreting significance.
Full-Number Repeat Model
Repeat frequencies across the 100,000 possible five-digit values were compared with a Poisson model:[8]
λ = 55,320 / 100,000 = 0.5532
Within-Draw Pair Analysis
Each set of ten results contains:
C(10,2) = 45 unordered pairsThe analysis examined:
- consecutive numbers;
- pairs within five values of each other;
- matching four-digit suffixes;
- first-digit concentration;
- minimum and maximum values.
Jackpot Comparison
The official prize structure was used to distinguish:
- the first prize;
- the consolation-prize number family;
- the ten independent five-digit second-prize results.
No published same-draw jackpot/second-prize overlap was found in 5,532 analyzed draws.
Observed live-draw redraw behavior is treated as an operational observation, while the formal separation of the prize categories is grounded in the official prize structure.
Limitations
The research does not include:
- individual machine serial numbers;
- equipment manufacturer records;
- drum-replacement history;
- ball-weight or wear measurements;
- complete maintenance logs;
- a full historical log of redraw events;
- or a pre-registered future prediction experiment.
Therefore, statistical differences should not be interpreted as proof of a specific mechanical cause or manipulation.
Sources & References
This research combines an original Lottery Sambad dataset with official state-lottery documents and established statistical references. The 55,320 second-prize results, repeat counts, digit-position frequencies, studio comparisons and pattern analysis were calculated independently by the Lottery Sambad Research Desk.
- Lottery Sambad Research Desk — Historical Dear Lottery Results Dataset. The primary analytical dataset used in this study: 5,532 verified draws from April 1, 2021 through August 1, 2026, containing 55,320 five-digit second-prize results. Historical published results can be explored in the Lottery Sambad Results Archive.
- Government of Nagaland, Directorate of State Lotteries — Official Result Gazette. Official Nagaland result notification used to verify the draw location, first-prize and consolation structure, and the second-prize method of drawing ten five-digit numbers applicable across the eligible serial and series structure. View official Nagaland result gazette.
- Nagaland State Lotteries, Finance Department — Official Live Draw Portal. Official live-draw page covering Dear 1 PM and Dear 8 PM draws and used as a primary reference for the Nagaland draw environment. View Nagaland State Lotteries live draws.
- Government of Sikkim, Directorate of Sikkim State Lotteries — Approved Dear 6 PM Weekly Lottery Scheme. Official scheme document specifying the 6 PM draw location in Deorali, Gangtok, the mechanical draw method, government-appointed judges, prize structure and the second-prize method of drawing ten five-digit winning numbers. View official Dear 6 PM scheme.
- Government of Sikkim — Sikkim State Lottery (Regulation) Rules, 2023. Primary regulatory source covering publication of lottery schemes, prize structures, draw locations, procedures for drawing winning numbers and official publication of results. View Sikkim State Lottery (Regulation) Rules, 2023.
- Government of India — The Lotteries (Regulation) Act, 1998 and Lotteries (Regulation) Rules, 2010. Central legal framework governing state-organized lotteries in India. View on India Code.
- National Institute of Standards and Technology (NIST) — Chi-Square Goodness-of-Fit Test. Statistical reference used for interpretation of observed-versus-expected digit-frequency tests and chi-square goodness-of-fit methodology. NIST Engineering Statistics Handbook.
- National Institute of Standards and Technology (NIST) — Poisson Distribution. Statistical reference for the Poisson model used to compare the observed frequency of zero, one, two, three and repeated appearances of five-digit values. NIST Engineering Statistics Handbook.
Source note: Official government documents are used to establish lottery rules, draw locations, prize structures and procedures. All frequency tables, p-values, repeat counts, pattern counts and comparisons specific to the 55,320-number dataset are original calculations by the Lottery Sambad Research Desk unless otherwise stated.
Notes on Statistical Interpretation
- A small p-value does not mean “the probability that the draw is random.”
- Statistical significance does not automatically imply a meaningful betting advantage.
- Historical frequency does not guarantee future frequency.
- The terms “hot” and “cold” describe observed history only.
- A number that has not appeared recently is not automatically “due.”
- A memorable pattern is not automatically more probable.
- Studio-level differences describe observed distributions and do not identify specific equipment faults.
- The absence of jackpot/second-prize overlap is interpreted together with the prize structure and observed draw procedure, not as standalone statistical proof.
For Journalists, Researchers and Publishers
This study is original research by the Lottery Sambad Research Desk.
The analysis may be cited with attribution.
Suggested Citation
“Lottery Sambad Research Desk analyzed 55,320 Dear Lottery second-prize numbers from 5,532 draws between April 2021 and August 2026. All five digit positions showed statistically significant departures from perfect uniformity, with the strongest effect in the fourth position, where digit 6 appeared 8.99% of the time. Despite those positional differences, the repeat distribution of complete five-digit numbers closely matched a Poisson random-collision model.”
Key Figures Available for Citation
- 55,320 five-digit second-prize results analyzed;
- 5,532 complete draws;
- 276,600 individual digits;
- 42,561 unique five-digit values;
- 57,439 values never appeared;
- digit 6 in the fourth position: 8.99%;
- digit 5 in the fourth position: 10.63%;
- three numbers appeared six times;
- four same-day cross-slot repeats;
- 541 palindrome appearances;
- 44444 appeared twice;
- 00000 and 99999 each appeared once;
- zero published same-draw jackpot/second-prize overlaps;
- 43% of unique jackpot values appeared in the second prize on other dates.