Lottery players have searched for lucky numbers for as long as lotteries have existed. Sevens are treated as special, repeated digits feel meaningful, some players follow “hot” endings, while others deliberately choose numbers that have not appeared for a long time because they believe those numbers are “due.”
But what happens when those beliefs are tested against the largest verified historical dataset we could assemble?
Lottery Sambad analyzed 5,497 first-prize jackpot results from the available historical results archive, covering April 1, 2021 through July 20, 2026.[1] We examined repeated five-digit winning numbers, digits, endings, number ranges, palindromes, series, prefixes and the time between repeats to answer one question: Is there any statistical evidence that some lottery numbers are genuinely luckier than others?
The answer from more than five years of verified results is strikingly consistent: we found remarkable coincidences, but no convincing statistical evidence that any specific five-digit number, digit or historical pattern has a persistent predictive advantage.[1]
The strongest result is not one spectacular number. It is the relationship between what randomness predicts and what actually happened.
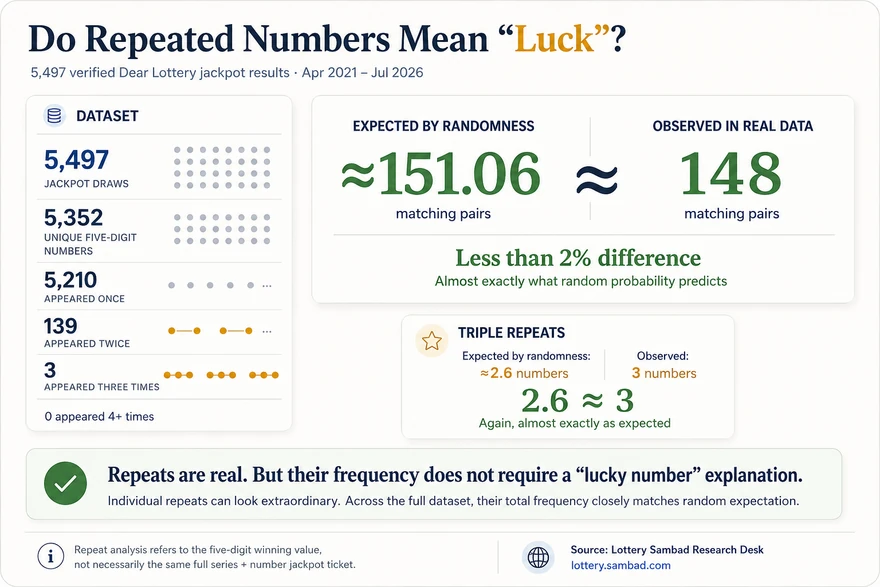
Random probability predicts approximately 151.06 matching pairs across 5,497 draws. The verified historical dataset contains 148.
The difference is less than 2%.
Key Findings
Observed matching pairs: 148. Random expectation: approximately 151.06.
Observed numbers appearing three times: 3. Expected under a uniform random model: approximately 2.6.
The Longest Verified Dear Lottery Dataset We Could Build
The underlying Lottery Sambad database contains more than 736,000 prize-result records across all prize tiers.[1] For this study, we isolated the first-prize ₹1 Crore result for every available draw between April 1, 2021 and July 20, 2026.
The final research dataset contains 5,497 jackpot records.[1] The archive begins on April 1, 2021 because that is the earliest date for which result material could be located after exhaustive checks of the available source archive.
The research period spans more than five years and includes the 1 PM, 6 PM and 8 PM draw schedules. Because the study covers the full available historical archive rather than a short sample, temporary streaks can be examined in the context of thousands of later results.
Every Draw Was Verified Against an Original Result Source
Dataset size alone is not enough for a study of unusual lottery patterns. A single duplicated or incorrectly imported jackpot number can create a false “same-day repeat,” an artificial streak or an apparently extraordinary lucky number.
For the final dataset, each jackpot record was checked against original published result material. The research archive contains approximately 5,496 original PDF result files totaling about 3.2 GB, plus one draw that was recovered from an official published result image and manually verified.[1][2][4]
The final comparison between source result material and the analytical database produced zero unresolved discrepancies in the dataset used for this study.
This source-verification step is essential because the purpose of the research is not simply to identify eye-catching coincidences. It is to determine whether those coincidences survive validation against the underlying historical record.
What Exactly Is a “Number” in This Study?
A complete first-prize result may look like:
56C 76811
This contains several components: 56 is a numeric prefix, C is a series letter, and 76811 is the five-digit winning number.
The main “Lucky Numbers” analysis focuses on the five-digit component:
00000–99999
There are exactly:
100,000 possible five-digit values.
This allows us to test whether certain five-digit values repeat more often than probability would predict.
A Five-Digit Winning Number Is Not the Same as a Full ₹1 Crore Jackpot Ticket
This distinction is essential. The ₹1 Crore first prize requires the correct series plus five-digit number, not only the five-digit component.[2][4]
Under the current structures used as context for this analysis, Nagaland State Lottery 1 PM and 8 PM draws can use a substantially larger series space than the Sikkim State Lottery 6 PM structure.
With 660 series and 100,000 five-digit values, the full series-number space is:
660 × 100,000 = 66,000,000 possible combinations.[2]
With 200 series:
200 × 100,000 = 20,000,000 possible combinations.[5]
Therefore, when this article says that a five-digit number appeared two or three times, that does not automatically mean the exact same full ticket combination won multiple times.
5,497 Jackpots Produced 5,352 Unique Five-Digit Numbers
Across the entire verified dataset, we found:
| Number of Appearances | Unique Five-Digit Numbers |
|---|---|
| Exactly once | 5,210 |
| Exactly twice | 139 |
| Exactly three times | 3 |
| Four times or more | 0 |
| Total unique values | 5,352 |
Only three five-digit values appeared three times in more than five years of jackpot history.
At first glance, those three numbers look like obvious candidates for the title of “luckiest Dear Lottery numbers.”
Probability tells a different story.
The Three Numbers That Appeared Three Times
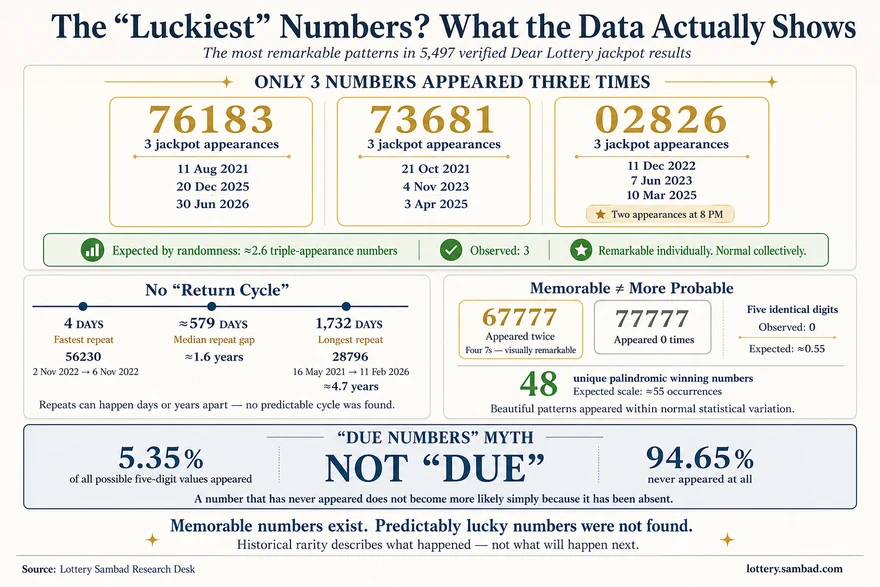
76183
76183 appeared on August 11, 2021, then again on December 20, 2025, and a third time on June 30, 2026.
73681
73681 appeared on October 21, 2021, November 4, 2023, and April 3, 2025.
02826
02826 appeared on December 11, 2022, June 7, 2023, and March 10, 2025. Two of those appearances occurred in the 8 PM slot.
These numbers are historically remarkable. But historical rarity is not the same as evidence of supernatural or predictive luck.
Three Triple Repeats Are Almost Exactly What Randomness Predicts
If 5,497 values are selected independently from 100,000 equally likely five-digit possibilities, some values should naturally appear more than once.[8]
The expected number of five-digit values appearing exactly three times is approximately:
2.6.
The verified dataset contains:
3.
This is an extraordinarily close match between theory and observation.
From the perspective of an individual player, a number that has appeared three times can feel almost magical. From the perspective of the full dataset, approximately three such numbers are exactly the kind of result a random process should produce.
148 Matching Pairs Were Observed. Randomness Predicts About 151
The strongest test is to stop focusing on individual “lucky” examples and count every numerical collision in the dataset.
There are 139 values that appeared exactly twice. Each creates one matching pair.
There are three values that appeared three times. Each triple produces three possible matching pairs.
Therefore:
139 + (3 × 3) = 148 observed matching pairs.[1]
For 5,497 selections from a space of 100,000 possibilities, the expected number of matching pairs is approximately:
151.06.
Observed:
148.
The gap is less than 2%.
This is one of the most important findings in the study because repeated numbers are often interpreted individually: “This number won again, so it must be lucky.”
But when all repetitions are counted together, the frequency is almost exactly what collision probability predicts.
The Fastest Confirmed Repeat Took Four Days
The shortest verified interval between repeated five-digit jackpot values was four days.
The number 56230 appeared on November 2, 2022 and again on November 6, 2022.
Both appearances occurred in the 6 PM draw.
This is a genuinely striking historical coincidence. But it does not mean that 56230 became a “hot” number after its first appearance.
An independent random selection can repeat a recent result without the previous result changing its future probability.
The Longest Repeat Gap Was Almost 4.7 Years
At the other extreme, the five-digit number 28796 appeared on May 16, 2021 and did not reappear until February 11, 2026.
The interval was:
1,732 days — approximately 4.7 years.
The first appearance occurred immediately before the long 2021 suspension in the historical draw calendar.
But the long interval itself does not show that the number accumulated probability or became “due.”
There Is No Detectable “Return Cycle”
Across the repeated values, the dataset contains 145 intervals between consecutive appearances.
Minimum: 4 days
Maximum: 1,732 days
Median: approximately 579 days, or about 1.6 years
The range is enormous.
One value returns after four days. Another takes almost five years. Many fall somewhere in between.
The data do not reveal a practical cycle such as “winning numbers usually return after one year” or “a number becomes due after 500 days.”
What About Four Sevens? The Case of 67777
One of the most visually memorable repeated values is:
67777
It appeared on February 19, 2024 and again on June 1, 2026.
Both appearances occurred in the 6 PM slot.
Four consecutive sevens make 67777 psychologically powerful because seven is widely associated with luck and gambling.
But mathematically, 67777 is still one specific five-digit value among 100,000 possibilities.
Its visual appearance does not give it a demonstrated probability advantage over an ordinary-looking value such as 48261.
Did 77777 Ever Win?
No.
The classic “lucky seven” number:
77777
did not appear as a jackpot-winning five-digit value in any of the 5,497 analyzed draws.
In fact, we observed zero jackpot values consisting of five identical digits, such as 11111, 22222, 55555 or 77777.
There are only 10 such values out of 100,000 possible five-digit strings, including 00000.
Across 5,497 draws, the expected number of such appearances is approximately:
0.55.
Observed:
0.
This is completely compatible with ordinary randomness.
Is There a “Luckiest” Last Digit?
Another common strategy is to ignore the full number and track only the final digit.
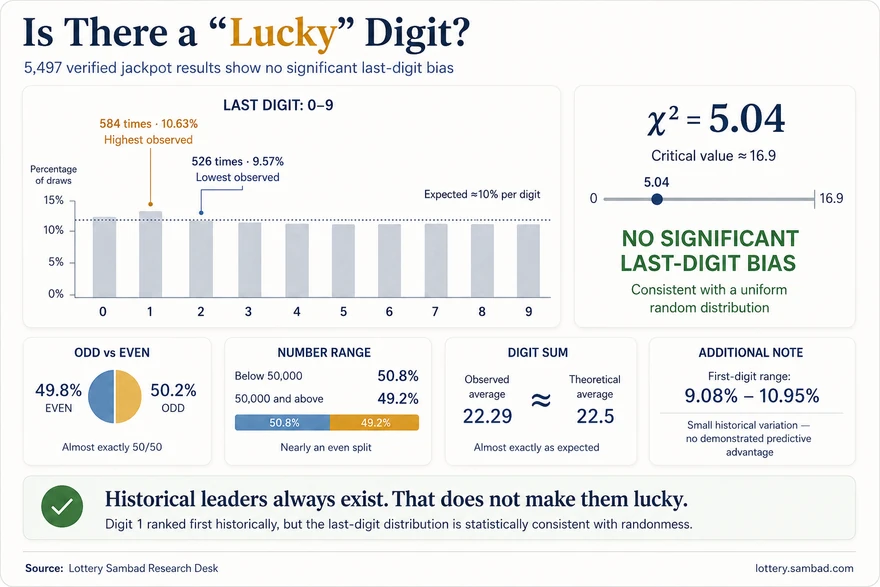
In the verified dataset, the most common final digit was:
1 — 584 appearances, 10.63%.
The least common was:
2 — 526 appearances, 9.57%.
There is a visible difference.
But random samples always produce a leader and a last-place value.
The real question is whether the difference is statistically larger than random variation should produce.
The Last-Digit Distribution Looks Like Randomness
If all ten final digits are equally likely, each should appear around 10% of the time over a large sample.
We tested the observed distribution using a chi-square goodness-of-fit test.[7]
χ² = 5.04
The standard critical value at the 0.05 level with 9 degrees of freedom is approximately:
16.9.[7]
The observed statistic is far below that threshold.
The final-digit distribution is therefore statistically consistent with a uniform random model.
Digit 1 was the historical leader. That does not make it a statistically demonstrated “lucky digit.”
More Data Made the “Lucky Digit” Theory Weaker, Not Stronger
Short samples can produce dramatic-looking streaks. A digit may dominate for several weeks or months and appear “hot.”
But as thousands of additional draws are added, temporary fluctuations tend to become easier to distinguish from persistent effects.
Across the full verified dataset, the final digits remained tightly clustered around the expected 10% level.
The larger dataset did not reveal a hidden lucky digit.
It made the distribution look even more consistent with ordinary random variation.
The First Digit Shows a Small Statistical Nuance
The first digit was somewhat less evenly distributed than the last digit.
Observed frequencies ranged from approximately:
9.08% for digit 9
to:
10.95% for digit 0.
A standalone chi-square calculation for this particular distribution is approximately 20.9, slightly above a conventional single-test threshold.
However, this study performs many simultaneous comparisons: first digit, last digit, number ranges, endings, parity, sums, positions, prefixes and other categories.
When many patterns are tested at the same time, one or more categories can cross a conventional threshold by chance. This is known as the multiple-comparisons problem.[9]
The practical effect size is also small: approximately 10.95% versus 9.08%.
Therefore, the appropriate conclusion is not that 0 is a “lucky first digit,” but that the historical dataset contains modest variation without a demonstrated predictive advantage that can be reliably used for future draws.
Number Ranges Are Also Close to Uniform
We divided the entire five-digit space into ten 10,000-number blocks:
00000–09999, 10000–19999, 20000–29999 and so on through 90000–99999.
Observed frequencies ranged from approximately:
10.95% for 00000–09999
to:
9.08% for 90000–99999.
Every ranking has a first and last place. The existence of a historical leader does not establish a persistent future advantage.
Below 50,000 vs. 50,000 and Above
The split is almost exactly balanced:
Below 50,000 — 50.8%
50,000 and above — 49.2%
There is no meaningful “luckier half” of the five-digit number space.
Odd vs. Even Is Almost a Perfect Coin Toss
The jackpot-winning five-digit values were:
49.8% even
50.2% odd
This is about as close to a 50/50 distribution as one would expect from thousands of random observations.
The Average Digit Sum Is Close to Theoretical Expectation
For a number such as 76183, the digit sum is:
7 + 6 + 1 + 8 + 3 = 25.
Across all 5,497 jackpot results:
Minimum digit sum: 2
Maximum: 43
Observed average: 22.29
The theoretical mean for a uniformly random five-digit string is:
22.5.
The observed result is very close.
The most common digit sums clustered around the middle, including 21, 24, 22, 20 and 26.
This is expected because far more digit combinations produce middle-range sums than extreme sums.
A frequently observed digit sum is therefore not automatically a lucky sum.
“Beautiful” Numbers Are More Memorable, Not More Probable
Humans are extremely good at recognizing patterns.
Values such as 11111, 67777, 57575 or 50005 attract far more attention than an ordinary-looking result such as 48261.
This creates a powerful memory bias: visually unusual numbers feel more statistically significant because we remember them better.
We Found 48 Unique Palindromic Jackpot Numbers
A palindrome reads the same from left to right and right to left.
Examples observed in the dataset include:
01510, 02020, 07270, 20202, 24642, 50005, 55455, 57575, 60006, 75757, 87878 and 96469.
We identified 48 unique palindromic values in the historical results.
The overall scale is close to what probability would naturally produce: roughly 55 palindrome occurrences would be expected across 5,497 uniformly random five-digit draws.
There is no evidence that palindrome structure gives a number a predictive advantage.
Why 67777 Feels More Important Than an Ordinary Repeat
Suppose two values each appear twice:
67777
and:
48261
Which one is more likely to be remembered?
Almost certainly 67777.
This is one reason lottery history appears more patterned in human memory than it does in a complete dataset.
We remember sevens, symmetry, repeated digits and meaningful dates.
We forget thousands of ordinary-looking values that carry exactly the same mathematical status.
Do “Lucky Endings” Exist?
We examined the final two digits of every jackpot number.
| Two-Digit Ending | Occurrences |
|---|---|
| 04 | 74 |
| 01 | 67 |
| 33 | 66 |
| 11 | 65 |
| 10 | 65 |
With 100 possible two-digit endings and 5,497 observations, the average expected frequency is approximately:
55 appearances per ending.
Ending 04 appeared 74 times and therefore ranked first historically.
Does that make 04 a better choice for the next draw?
No statistical evidence in this study supports that conclusion.
Why a 2.6σ Historical Leader Can Still Be Noise
One important reason is that we are not examining one preselected ending.
We are examining:
100 endings simultaneously.
When 100 categories are ranked, one of them must be the highest, and the maximum observed deviation will naturally be more extreme than the deviation of a single preselected category.
The historical leader therefore cannot be evaluated as though it were the only ending we tested.
This is another form of the multiple-comparisons problem.[9]
Ending 04 is a real historical leader.
That does not make it a demonstrated predictive signal.
Three-Digit Endings Create Even More Opportunities for False Patterns
Among the most frequent three-digit endings were:
004 — 16 appearances
906 — 14
386 — 14
There are 1,000 possible three-digit endings.
When one thousand categories are searched for the strongest historical pattern, some categories will inevitably look unusual.
Finding a striking pattern after examining the entire dataset is not the same as predicting that pattern before it happens.
There Is No Evidence That “Hot Numbers” Predict the Future
By historical definition, 76183, 73681 and 02826 are the “hottest” complete five-digit values in the dataset because each appeared three times.
That description is valid as history.
But the fact that these numbers appeared three times does not create evidence that any of them has an elevated probability of appearing a fourth time.
Historical frequency describes the past. It does not automatically become a predictive model.
“Due Numbers” Have the Opposite Myth — and the Same Statistical Problem
Another strategy is to choose numbers that have never appeared or have been absent for years.
There are 100,000 possible five-digit values.
Only:
5,352 unique values
appeared in the entire study period.
That means only:
5.35%
of the five-digit number space was represented.
Approximately:
94.65%
of possible five-digit values never appeared at all.
If absence made a number “due,” then nearly the entire number space would be due simultaneously.
That provides no useful predictive information.
Randomness Does Not Need to Use Every Number Before Repeating One
This is one of the least intuitive features of random sampling.
People often imagine a random system gradually working through unused values before returning to old ones.
But a random process has no such obligation.
It can repeat one value several times while tens of thousands of other possible values have never appeared.
That is why a dataset can simultaneously contain 139 double appearances, three triple appearances and more than 94,000 possible numbers that were never selected.
This is not a contradiction.
It is expected behavior in a large random number space.
Series Letters Are Not Automatically “Lucky Letters”
The verified historical dataset contains ten series letters:
A, B, C, D, E, G, H, J, K and L.[1]
Series information is now complete for every draw in the analyzed dataset.[1] The letter frequencies remain closely distributed: J appeared most often with 571 jackpot records, or approximately 10.39%, while C appeared least often with 528, or approximately 9.61%.
The difference is relatively small, and raw series frequency should not be interpreted as evidence that one letter is inherently “luckier” than another.
Series analysis is fundamentally different from five-digit number analysis because the availability and exposure of a series depend on the structure of each lottery scheme, draw schedule and historical series range.[2][5]
Therefore, a simple ranking of series letters cannot reliably identify a “luckiest series.”
Series coverage in this study is complete: every analyzed jackpot draw now has a verified full series identifier, allowing series letters and numeric prefixes to be analyzed without the historical metadata gaps present in earlier database versions.
1 PM, 6 PM and 8 PM Do Not Have Identical Series Exposure
Different draw structures can contain different numbers of eligible series and different numeric-prefix ranges.
That means two prefixes may not have had the same number of historical opportunities to appear.
Any serious comparison of series or prefixes must normalize for:
- draw schedule;
- eligible series range;
- historical changes in lottery schemes and series ranges;
- the number of opportunities each prefix or series had to participate across different draw structures.
Without those adjustments, raw frequency is exposure data as much as it is result data.
Why Prefixes 99, 93 and 91 Rank Near the Top
Across the fully verified dataset, 79 different numeric prefixes were identified, ranging from 27 to 199. The lower end of this historical range includes verified combinations such as 27E, 30E and 31C from 2021 and early 2022.[1]
The most frequently observed numeric prefixes in the fully reconstructed series dataset were:
99 — 163 appearances
93 — 161
91 — 159
87 — 155
86 — 154
92 — 154
It would be tempting to call 99 the “luckiest prefix.”
That would be misleading.
Prefixes that exist across more draw structures or broader historical scheme periods naturally receive more opportunities to appear.
A higher raw count may reflect greater exposure rather than greater luck.
The Probability of One Five-Digit Number Is 1 in 100,000
There are 100,000 possible five-digit values from 00000 through 99999.
Under a uniform model, one specific predetermined five-digit value represents:
1 out of 100,000 possible five-digit outcomes in a draw.
But this is not the same as the probability attached to one specific full ₹1 Crore ticket.
A Full Jackpot Combination Can Be One of Tens of Millions
The full first-prize combination includes series plus five-digit number.
Depending on the draw structure, the complete series-number space can be on the order of:
20 million to 66 million combinations.
This is why statements such as:
“The number has a 1-in-100,000 chance.”
must not automatically be translated into:
“This specific ticket has a 1-in-100,000 chance of winning ₹1 Crore.”
They are different events.
The complete series-and-number space across all three daily draws — and why even that figure cannot be converted into ticket sales or player counts — is analyzed in our separate market-scale study: How Many People Play Dear Lottery? What 56.5M Searches Show.
An Unexpected Finding: Hundreds of Historical Jackpot Tickets Were Marked “Returned To Government”
During the full archive audit, we found another historically important pattern that is separate from the lucky-number question.
In official result publications from 2021 and 2022, some first-prize combinations were explicitly marked:
“Returned To Government.”[1][10]
This indicates that the relevant winning-ticket stock had been returned rather than sold to a player.
2021
296 of 735 jackpot results — approximately 40.3% — carried the Returned To Government designation.
2022
267 of 904 jackpot results — approximately 29.5% — were identified this way in the verified historical dataset.
Based on these year-level counts, that is:
563 first-prize results across 2021–2022.[10]
From 2023 onward, the same designation is no longer present in the publication format used by the archive.
Why “Returned To Government” Matters When Talking About Luck
A published winning number does not necessarily mean that a player was holding the corresponding winning jackpot ticket.
Historically, a first-prize combination could be drawn even though the corresponding ticket stock had been returned and was not in a buyer's hands.
This reinforces an important distinction:
The history of winning numbers is not automatically the same thing as the history of actual jackpot winners.
What 5,497 Verified Jackpots Actually Tell Us About Lucky Numbers
1. Repeats Exist Because Randomness Naturally Produces Repeats
There were 139 double appearances and three triple appearances. The total number of matching pairs was 148, compared with approximately 151.06 expected under a simple uniform random model.
2. Three Triple-Appearance Numbers Are Not an Extraordinary Statistical Excess
76183, 73681 and 02826 each appeared three times. The expected number of values appearing exactly three times is approximately 2.6. Observed: three.
3. No Statistically Convincing “Lucky Last Digit” Was Found
Final-digit frequencies ranged from 9.57% to 10.63%. The chi-square statistic was 5.04, well below the conventional 16.9 critical value for 9 degrees of freedom.
4. A Fast Repeat Does Not Create a “Hot Number”
56230 repeated after only four days. That is an interesting historical event, not evidence that the number acquired a greater future probability.
5. A Long Absence Does Not Make a Number “Due”
28796 took 1,732 days to reappear. The long absence was not evidence of a probability debt that had to be repaid.
6. Beautiful Numbers Are More Memorable, Not More Probable
67777 appeared twice. 77777 never appeared. Palindromes appeared at roughly the scale expected from random chance. Visual structure does not create a demonstrated mathematical advantage.
7. Historical Leaders Will Always Exist
There will always be a most common last digit, a most common ending, a most frequent prefix and a fastest repeat. Ranking first historically does not automatically mean having a persistent predictive advantage.
The Biggest Trap in Lucky-Number Analysis Is Missing Context
Consider two headlines.
“Number 76183 Wins the Jackpot for the Third Time.”
and:
“In 5,497 Draws, Probability Predicts About 2.6 Numbers Should Appear Three Times. We Observed Three.”
Both statements describe the same historical reality.
But they create completely different impressions.
The first creates a story about luck.
The second provides the statistical denominator.
Many lottery myths begin when a remarkable event is shown without the full population of events against which it should be judged.
The Most Important Number in This Study Is 148 vs. 151
It is tempting to focus on 76183, 67777, the ending 04 or the fastest four-day repeat.
But the strongest finding is much less dramatic:
Expected matching pairs: ≈151.06
Observed matching pairs: 148
This near-match captures the central lesson of the research.
Randomness does not mean that repeats disappear.
Randomness means that the overall statistical frequency of unpredictable individual repeats can itself be predictable.
We cannot know in advance which specific numbers will repeat.
But probability can estimate approximately how many collisions a dataset of this size should contain.
The verified Dear Lottery history came remarkably close to that expectation.
Conclusion: Lottery History Has “Lucky Numbers.” Statistics Does Not
We can call 76183 lucky because it appeared three times.
We can call 67777 lucky because four sevens make it visually extraordinary and it appeared twice.
We can call 04 lucky because it became the most common historical two-digit ending.
All of those descriptions look backward.
The question that matters to a player is different:
Does the historical pattern make the same number more likely to win the next independent draw?
Across 5,497 verified jackpot results, we found no convincing evidence that it does.
- 148 matching pairs were observed versus approximately 151.06 expected;
- three values appeared three times versus approximately 2.6 expected;
- final digits were statistically consistent with a uniform distribution;
- odd and even values were almost exactly 50/50;
- the lower and upper halves of the number range were almost 50/50;
- the average digit sum was 22.29 versus a theoretical 22.5;
- visually memorable values showed no demonstrated predictive advantage;
- repeat intervals ranged from four days to nearly 4.7 years without a useful return cycle.
The most defensible conclusion is therefore not:
“We found the luckiest Dear Lottery numbers.”
It is:
We found many extraordinary-looking numbers, but no convincing statistical evidence that any specific five-digit number, digit or historical ending is inherently luckier in a future draw.
That is the central paradox of lottery randomness.
Across thousands of draws, chance inevitably creates repeats, streaks, beautiful numbers and coincidences that look too meaningful to be random.
But when we stop looking at one extraordinary event and examine the entire verified dataset, those apparent “miracles” begin to occur at roughly the frequency mathematics says they should.
Randomness does not look random in every individual event. It becomes visible when we look at the whole dataset.
The geographic side of the same question — whether “lucky” cities or lottery shops exist — is examined in a separate Lottery Sambad study: Where Are Dear Lottery Jackpot Tickets Sold? Analysis of 1,814 Jackpot Records.
Methodology
- Study period
- April 1, 2021 through July 20, 2026.
- Primary research source
- Lottery Sambad structured prize-results database, cross-checked against the Lottery Sambad historical results archive and original published result material.[1]
- Total source database
- More than 736,000 prize-result records across all prize tiers.
- Prize category analyzed
- First-prize ₹1 Crore jackpot result for each included draw.
- Total jackpot records analyzed
- 5,497.
- Unique five-digit values
- 5,352.
- Source verification
- Each analyzed jackpot result was checked against original published result material. The research archive includes approximately 5,496 PDF result files plus one draw recovered from an official published result image and manually verified. Series information was reconstructed and verified for every draw in the analytical dataset, including a subset of historical records where series data were present in the original published PDF layout but were missing or incomplete in the machine-readable text layer.[1][2][4]
- Primary analytical unit
- The five-digit winning value from 00000 through 99999, analyzed separately from numeric prefix and series letter.
- Analyses performed
- Repeat frequency, matching-pair collisions, triple appearances, repeat intervals, digit frequencies, first and last digits, number ranges, odd/even distribution, digit sums, palindromes, repeated-digit patterns, two- and three-digit endings, series letters and numeric prefixes.
- Collision benchmark
- The expected number of matching pairs was calculated from 5,497 selections across 100,000 possible five-digit values: approximately 151.06 matching pairs.
- Triple-repeat benchmark
- Under the same uniform random model, the expected number of five-digit values appearing exactly three times is approximately 2.6. Three were observed.
- Digit-distribution test
- A chi-square goodness-of-fit test was used to compare final-digit frequencies against a uniform 0–9 distribution.[7]
- Multiple comparisons
- Because the study examines many digits, endings, prefixes and pattern categories simultaneously, isolated historical leaders are interpreted in the context of multiple-comparison risk.[9]
Data Completeness: Why 105 Calendar Dates Are Absent
The 105 dates without results are verified no-draw days, not missing records.[1] They consist primarily of a 28-day COVID-related suspension in 2021, a 61-day lottery suspension in 2022, 15 recurring national-holiday closures across Republic Day, Independence Day and Gandhi Jayanti, and one isolated cancellation on June 19, 2023.
Each missing date was checked through exhaustive source-file searches and cross-referenced against the historical official video-stream archive.[1][3][4] No draw evidence was found for those dates. The analytical dataset therefore treats them as days on which no lottery draw occurred, rather than gaps in data collection.
Historical result records that do exist can be reviewed through the Lottery Sambad Old Results archive.
Sources & References
This study combines original Lottery Sambad historical data analysis with official state-lottery result publications, official lottery scheme documents and established statistical references. Unless otherwise stated, all jackpot counts, repeat statistics, digit distributions, series and prefix counts, repeat intervals, palindrome counts and observed-versus-expected comparisons specific to the 5,497-draw dataset are original calculations by the Lottery Sambad Research Desk.
- Lottery Sambad Research Desk — Verified Dear Lottery Jackpot Dataset and Historical Results Archive. The primary research dataset used in this study contains 5,497 verified first-prize jackpot results covering April 1, 2021 through July 20, 2026. Each analytical record was cross-checked against original published result material retained in the research archive. Historical result pages can be reviewed through the Lottery Sambad Old Results Archive.
- Government of Nagaland, Finance Department — Nagaland State Lotteries Result Gazettes. Official Nagaland State Lotteries result publications used as a primary reference for Dear Lottery jackpot results, prize structure, series-number format, draw administration and Nagaland draw records. View official Nagaland State Lotteries Result Gazettes.
- Government of Nagaland, Finance Department — Directorate of Nagaland State Lotteries. Official departmental source describing the Directorate of Nagaland State Lotteries and its role in conducting and monitoring lottery draws. Visit Nagaland State Lotteries.
- Government of Sikkim — Sikkim State Lotteries Official Results. Official Sikkim State Lotteries source used for Dear 6 PM draw context, published results and the distinction between the Nagaland and Sikkim daily draw structures. View official Sikkim State Lotteries results.
- Government of Sikkim, Directorate of Sikkim State Lotteries — Official Lottery Schemes. Official scheme documents used to verify the current Dear 6 PM structure, including its series framework, prize structure and draw configuration. View official Sikkim State Lotteries schemes.
- Government of Sikkim — Sikkim State Lottery (Regulation) Rules, 2023. Official regulatory source providing additional context on lottery schemes, draw procedures, result publication and state-lottery administration. View Sikkim State Lottery (Regulation) Rules, 2023.
- National Institute of Standards and Technology (NIST) — Chi-Square Goodness-of-Fit Test. Statistical reference for the chi-square goodness-of-fit methodology used to evaluate whether observed digit frequencies are consistent with a specified probability distribution. NIST Engineering Statistics Handbook — Chi-Square Goodness-of-Fit Test.
- National Institute of Standards and Technology (NIST) — Binomial Distribution. Statistical reference for discrete-event probability calculations relevant to the expected frequency of repeated appearances of a predetermined five-digit value under a uniform model. NIST Engineering Statistics Handbook — Binomial Distribution.
- National Institute of Standards and Technology (NIST) — Multiple Comparisons. Methodological reference for interpreting many simultaneous statistical comparisons. This is relevant to the article's analysis of digits, endings, prefixes and other categories, where historical leaders should not be treated as if they were the only categories tested. NIST Engineering Statistics Handbook — Multiple Comparisons.
- Lottery Sambad Historical Archive — Original Result Publications Marked “Returned To Government.” The historical archive contains original result material from 2021 and 2022 in which some first-prize combinations were explicitly marked “Returned To Government.” The year-level totals reported in this study were calculated by the Lottery Sambad Research Desk from the verified historical archive. Examples and historical records can be reviewed through the Lottery Sambad Old Results Archive.
Source note: Official Nagaland and Sikkim sources are used to establish lottery administration, published draw structures, prize structures and official result context. NIST references are used for statistical methodology. The figures specific to this research — including 5,497 jackpot records, 5,352 unique five-digit values, 148 observed matching pairs, the approximately 151.06 collision benchmark, repeat intervals, digit counts, palindrome counts, series frequencies, prefix frequencies and “Returned To Government” totals — are original Lottery Sambad Research Desk calculations unless otherwise stated.
Notes on Statistical Interpretation
Five-digit number vs. full jackpot ticket: A repeated five-digit number does not necessarily mean the exact same full series-and-number ticket combination repeated.
Historical frequency is descriptive, not automatically predictive: A number that appeared more frequently in the past does not by itself have a demonstrated higher probability in the next independent draw.
Multiple comparisons matter: When hundreds or thousands of digits, endings, prefixes and patterns are examined, some categories will naturally rank unusually high or low by chance.
Series exposure differs: Series and prefixes do not necessarily have equal historical exposure across all draw types and scheme periods. Raw series counts should not be interpreted as pure measures of luck.
Random-model comparisons are benchmarks: Close agreement with a uniform random model shows that the observed numerical patterns do not require a “lucky number” explanation. It does not independently audit or prove every physical draw mechanism.
For Journalists, Researchers and Publishers
This analysis is based on original research conducted by the Lottery Sambad Research Desk using a verified historical dataset of 5,497 first-prize jackpot results covering April 1, 2021 through July 20, 2026.
Journalists, researchers, publishers and data analysts may cite findings, statistics and tables from this study. When referencing the data, please identify Lottery Sambad as the source of the analysis and cite this article as the original research source.
Suggested Citation
“According to a Lottery Sambad analysis of 5,497 verified jackpot results from April 2021 through July 2026, the dataset contained 148 matching pairs of five-digit winning numbers, compared with approximately 151 expected under a uniform random model.”
Key Data Available for Citation
- 5,497 verified first-prize jackpot results analyzed.
- 5,352 unique five-digit winning values.
- 5,210 values appeared exactly once.
- 139 values appeared exactly twice.
- Three values appeared exactly three times: 76183, 73681 and 02826.
- No five-digit value appeared four or more times.
- 148 matching pairs were observed versus approximately 151.06 expected under a uniform random model.
- Approximately 2.6 values appearing exactly three times would be expected; three were observed.
- The shortest verified repeat interval was four days.
- The longest verified repeat interval was 1,732 days, approximately 4.7 years.
- The final-digit chi-square statistic was 5.04, showing no statistically significant departure from a uniform 0–9 distribution under the stated test.
- Only about 5.35% of the 100,000 possible five-digit values appeared during the study period.